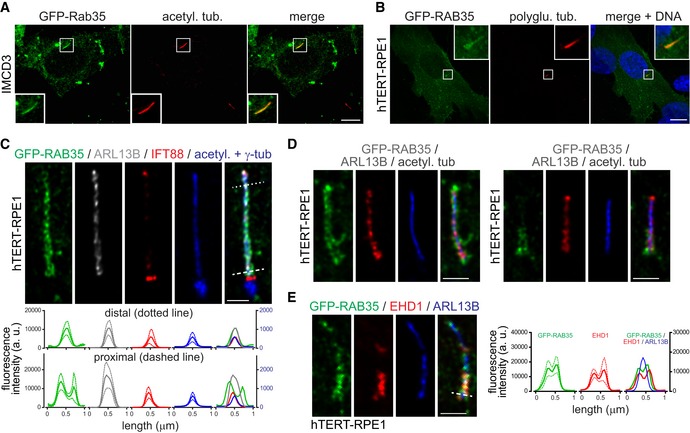
Localisation of transiently expressed GFP‐Rab35 in IMCD3 cells after 48 h serum starvation and staining for acetylated tubulin (acetyl. tub.) and DNA. Insets show higher magnification images of the cilia region. Scale bars, 10 μm.
Localisation of transiently expressed GFP‐RAB35 in hTERT‐RPE1 cells after 24 h serum starvation and staining for polyglutamylated tubulin (polyglu. tub.) and DNA. Insets show higher magnification images of the cilia region. Scale bars, 10 μm.
Super‐resolution (FV‐OSR) imaging of hTERT‐RPE1 stably expressing GFP‐RAB35 after 24 h serum starvation and staining for GFP, ARL13B (cilia membrane), IFT88 (axoneme), acetylated tubulin (acetyl. tub.; axoneme), and γ‐tubulin (γ‐tub; centrosome). Top panels show representative images, and bottom panel shows line profile plots of fluorescence intensity (arbitrary units; a. u.) in the distal (dotted line) and proximal (dashed line) cilia regions. Data are mean ± SEM (n = 5 cilia), with the solid line in the line profile plots indicating mean and the dotted lines indicating SEM values. Scale bars, 1 μm.
Representative FV‐OSR images of 24 h serum‐starved hTERT‐RPE1 stably expressing GFP‐RAB35 and stained for GFP, ARL13B and acetylated tubulin. Right panels show a cilium with proximal enrichment of GFP‐RAB35 and left panels a cilium with even GFP‐RAB35 localisation along the full length. Scale bars, 1 μm.
Representative FV‐OSR images of 24 h serum‐starved hTERT‐RPE1 stably expressing GFP‐RAB35 and stained for GFP, EHD1 and ARL13B. Line profile plots of fluorescence intensity in the proximal cilia region (dashed line) are shown to the right. Data are mean ± SEM (n = 6 cilia), with the solid line in the line profile plots indicating mean and the dotted lines indicating SEM values. Scale bars, 1 μm.

