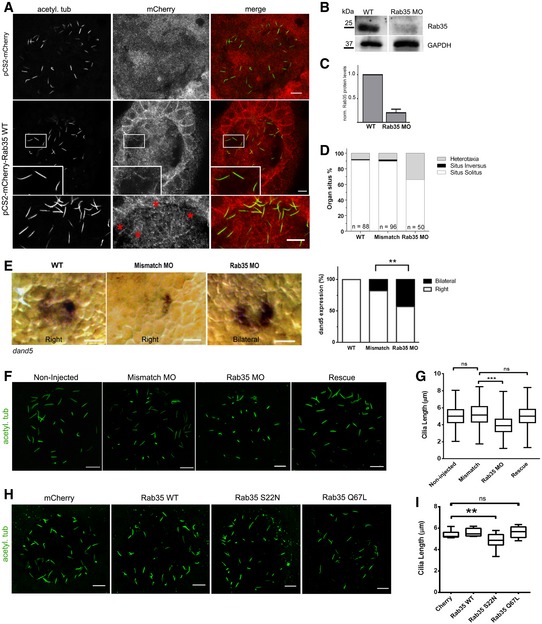
Figure 4. Zebrafish Rab35 regulates KV cilia length and left‐right organ patterning.

-
AImmunostaining of representative images of KV embryos at 8 somite stage in which mRNA encoding for mCherry or mCherry‐Rab35 WT was injected. Staining of acetylated tubulin was used as cilia marker. Inset shows a higher magnification image of the cilia region, displaying co‐localisation of mCherry‐Rab35 and acetylated tubulin. Scale bar, 10 μm.
-
B, CImmunoblot analysis with anti‐Rab35 and anti‐GAPDH antibodies of 40 μg of total lysates of zebrafish embryos injected with Rab35 morpholino (MO) at 8 somite stage, compared with non‐injected embryos. The plot in (C) shows Rab35 protein level in non‐injected and Rab35 morphants, normalised to GAPDH protein level. Data are mean ± SEM of three independent experiments (n > 50 embryos per condition).
-
DOrgan situs was determined by observing the heart position at 30 h post‐fertilisation (hpf), and the liver position at 53 hpf, by in situ hybridisation with a probe for foxa3, in controls (mismatch MO and non‐injected [WT]) and Rab35 MO. Situs solitus means left heart and liver; situs inversus means right heart and liver; and heterotaxia means any other possible combination of the heart and liver position.
-
EWhole‐mount in situ hybridisation with the dand5 probe at 8 somite stage (13 hpf) in wild‐type non‐injected embryos and mismatch morphants, both presenting right‐sided distribution of dand5, and Rab35 morphants presenting bilateral localisation of the dand5 probe. Scale bar, 50 μm. Graph shows quantification of embryos (%) with bilateral or right‐sided dand5 localisation from both conditions. Statistical significance according to Fisher Exact test (**P = 0.0002).
-
F–IImmunostaining of representative images of KV embryos at 8 somite stage in which: (F) Mismatch or Rab35 MO was injected, as well as a co‐injection of Rab35 MO with mRNA encoding mCherry‐Rab35 WT [Rescue]; (H) mRNA encoding mCherry or mCherry‐tagged Rab35 WT, Rab35‐Q67L or Rab35‐S22N were injected. Acetylated tubulin is shown in green as cilia marker. Quantification of KV cilia length in (F) and (H) is shown, respectively, in (G) and (I) as box‐and‐whisker plots of three independent experiments. N ≥ 8 embryos and n > 300 cilia per experimental condition. Horizontal lines show 25, 50 and 75th percentiles; whiskers extend to minimum and maximum values. Statistical significance according to Kruskal–Wallis followed by Dunn's post hoc test (**P < 0.01, ***P < 0.001, ns. not significant; Mismatch vs. Rab35 MO, P < 0.001; Cherry vs. Rab35‐SN, P = 0.0063). Scale bars, 10 μm.
Source data are available online for this figure.
