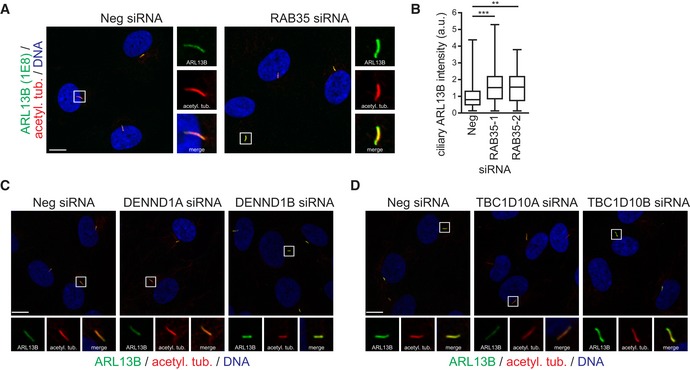
Figure EV4. RAB35, DENND1B and TBC1D10A regulate ciliary ARL13B levels in hTERT‐RPE1 cells.

-
A, BhTERT‐RPE1 cells transfected with non‐targeting siRNA control (Neg) or RAB35 siRNAs were serum‐starved for 48 h and stained for ARL13B (rat monoclonal antibody 1E8), acetylated tubulin (acetyl. tub.) and DNA. Representative images are shown in (A). Regions within white boxes shown at higher magnifications to the right. Scale bars, 10 μm. (B) Box‐and‐whisker plots show quantification of ciliary ARL13B intensity in arbitrary units (a. u.). Horizontal lines show 25, 50 and 75th percentiles; whiskers extend to minimum and maximum values. One representative experiment out of three is shown (n > 50 cilia per experimental condition). Statistical significance according to Kruskal–Wallis followed by Dunn's post hoc test (**P < 0.01, ***P < 0.001; P‐values: Neg vs. RAB35‐1 P < 0.0017, Neg vs. RAB35‐2 P = 0.0003).
-
C, DRepresentative images of hTERT‐RPE1 cells transfected with indicated siRNAs. Cells were serum‐starved for 48 h and stained for ARL13B, acetylated tubulin (acetyl. tub.) and DNA. Regions within white boxes shown at higher magnifications in smaller panels. Scale bars, 10 μm.
