-
A, B
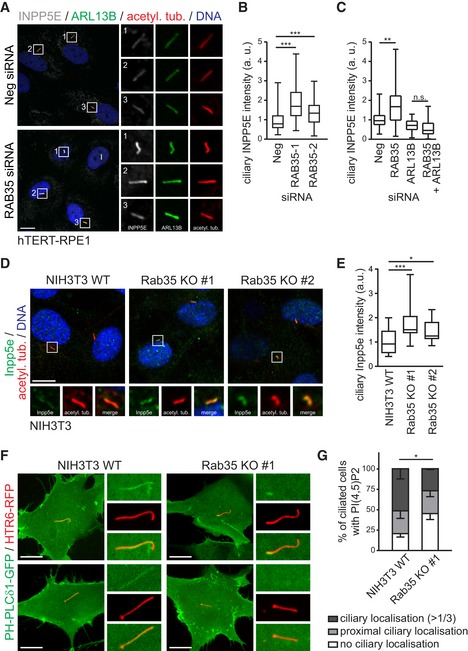
hTERT‐RPE1 cells transfected with non‐targeting siRNA control (Neg) or RAB35 siRNA, were serum‐starved for 48 h and stained for INPP5E, ARL13B, acetylated tubulin (acetyl. tub.) and DNA. Representative images are shown in (A). Regions within white boxes shown at higher magnifications to the right. Scale bars, 10 μm. (B) Box‐and‐whisker plots show quantification of ciliary INPP5E intensity in arbitrary units (a. u.). Horizontal lines show 25, 50 and 75th percentiles; whiskers extend to minimum and maximum values. One representative experiment out of three is shown (n > 50 cilia per experimental condition). Statistical significance according to Kruskal–Wallis followed by Dunn's post hoc test (***P < 0.001; P‐values: Neg vs. RAB35‐1 P < 0.0001, Neg vs. RAB35‐2 P = 0.0002).
-
C
For co‐depletion experiments, hTERT‐RPE1 cells were first transfected with Neg or RAB35 siRNA. After 24 h, a second transfection with Neg or ARL13B siRNA was performed and cells were serum‐starved for 48 h and stained as in (A). Horizontal lines show 25, 50 and 75th percentiles; whiskers extend to minimum and maximum values. One representative experiment out of three is shown (n > 40 cilia per experimental condition). Statistical significance according to Kruskal–Wallis followed by Dunn's post hoc test (**P = 0.0017).
-
D, E
NIH3T3 wild‐type (WT) and Rab35 knockout (KO) cell lines were serum‐starved for 24 h and stained for Inpp5e, acetylated tubulin (acetyl. tub.) and DNA. Representative images are shown in (D). Higher magnifications of regions within white boxes shown at the bottom. Scale bars, 10 μm. (E) Box‐and‐whisker plots show quantification of ciliary Inpp5e intensity in arbitrary units (a. u.). Horizontal lines show 25, 50 and 75th percentiles; whiskers extend to minimum and maximum values. One representative experiment out of three is shown (n > 25 cilia per experimental condition). Statistical significance according to Kruskal–Wallis followed by Dunn's post hoc test (*P < 0.05, ***P < 0.001; NIH3T3 WT vs. Rab35 KO#1 P < 0.0001, NIH3T3 WT vs. Rab35 KO#2 P = 0.0345).
-
F, G
Localisation of the PI(4,5)P2 sensor PH‐PLCδ1‐GFP to cilia in live NIH3T3 WT and Rab35 KO cells. Cilia are marked with HTR6‐RFP. Representative images are shown in (F). Higher magnification images of the cilia region shown to the right. Scale bars, 10 μm. Quantification of localisation in (G). Data are mean ± SEM of three independent experiments (n > 100 cilia per experimental condition). Statistical significance according to two‐way ANOVA (*P = 0.0242).

