
Figure EV1. Characterization of the novel Xist‐TetOP mutants.
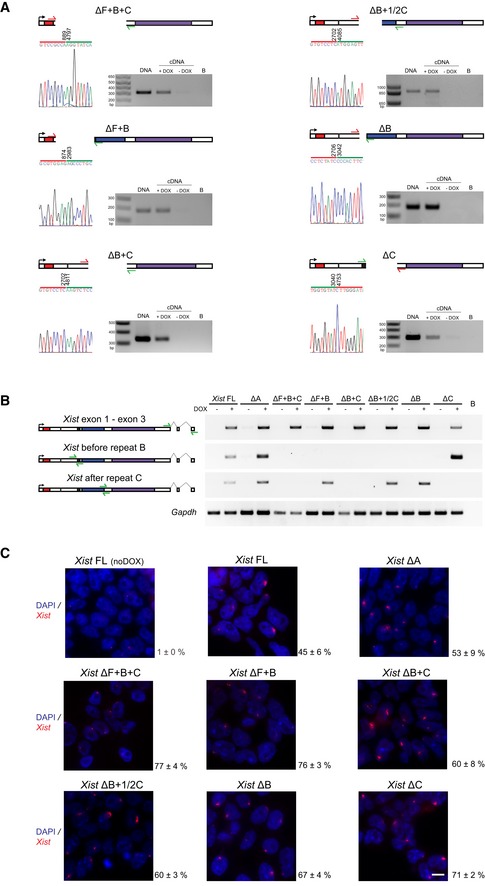
- Deletion mapping by Sanger sequencing and expression analysis across deleted regions in the novel Xist ΔF+B+C, ΔB+F, ΔB+C, ΔB+1/2C, ΔB, and ΔC mutants (this analysis is for clone 1 of each mutant type); the scheme represents only the first exon of Xist, and the color code for repeats matches the one on Fig 1A; red arrows indicate forward primers, and green arrows represent reverse primers; the primer on the left is the sequencing primer for each mutant; B means PCR blank.
- RT–PCR analysis of the splicing pattern and expression across the repeat B and C regions of the different Xist‐TetOP mutants using the primer pairs indicated in the scheme in green (Appendix Table S2); B means PCR blank.
- Xist RNA FISH analysis upon D4 of differentiation in the presence of DOX (also noDOX for Xist FL) in the Xist ΔF+B+C, ΔB+F, ΔB+C, ΔB+1/2C, ΔB, and ΔC mutants (this analysis is for clone 1 of each mutant type); values represent the % ± SEM of cells with a Xist‐coated chromosome (at least three biological replicates with a minimum of 250 cells counted per replicate; only two biological replicates for Xist FL noDOX); scale bar: 10 μm.
Source data are available online for this figure.