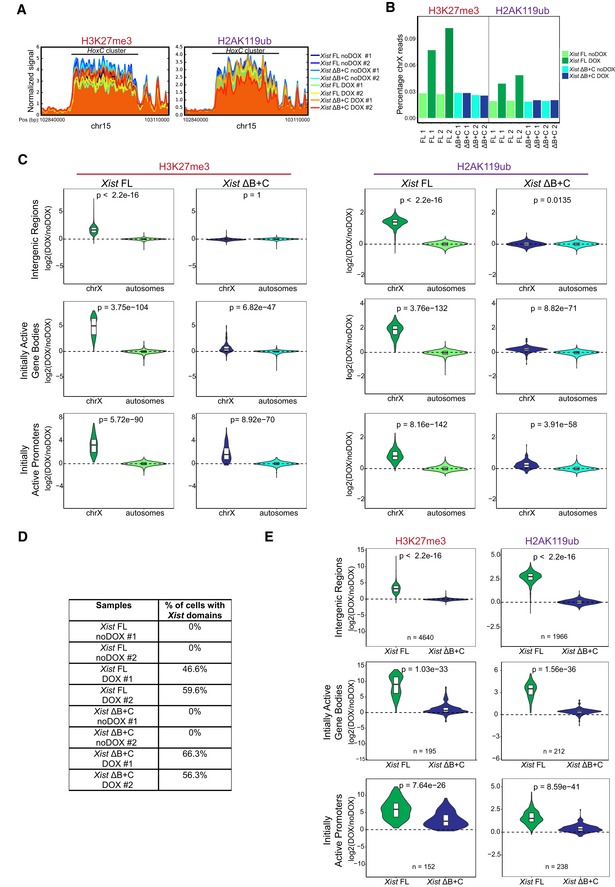
Figure EV4. Normalization of nChIP‐seq to the percentage of Xist‐induced cells in Xist FL and Xist ΔB+C confirms residual enrichment of PcG marks at initially active X‐linked genes.

- Normalized signal of H3K27me3 and H2AK119ub around HoxC cluster (chr15: 102,840,000–103,110,000); shown is the signal of each sample around these cluster, normalized by the size of the library.
- Barplot representing percentages of H3K27me3 and H2AK119ub reads mapping on X chromosome (chrX) in each sample.
- Violin plots quantifying H3K27me3 and H2AK119ub enrichment over intergenic regions, initially active promoters, and initially active gene bodies on chrX and on autosomes in Xist FL and Xist ΔB+C cell lines upon DOX induction at day 2 of differentiation; shown is the distribution of the calculated log2 fold change in DOX versus noDOX conditions, the horizontal band is the median, and the lower and upper hinges correspond to the 25th and 75th percentiles; P‐values were calculated using unilateral Wilcoxon test, comparing chrX and autosomal enrichment of PcG marks for each genomic region.
- Table showing the percentage of cells exhibiting a Xist‐coated chrX for the different duplicates of Xist FL and Xist ΔB+C in DOX and noDOX conditions as determined by Xist RNA FISH; a minimum of 500 cells were counted to calculate the percentage of cells with a Xist‐coated chrX.
- Violin plots quantifying H3K27me3 and H2AK119ub enrichment over intergenic regions, initially active promoters, and gene bodies on chrX in Xist FL and Xist ΔB+C upon DOX induction at day 2 of differentiation after normalization for the percentage of cells with Xist‐coated chromosomes. Shown is the distribution of the calculated log2 fold change in DOX versus noDOX conditions, the horizontal band is the median, and the lower and upper hinges correspond to the 25th and 75th percentiles; n = indicates the number of genes analyzed; P‐values were calculated using a paired Wilcoxon test, comparing Xist FL and Xist ΔB+C cell lines.
Source data are available online for this figure.
