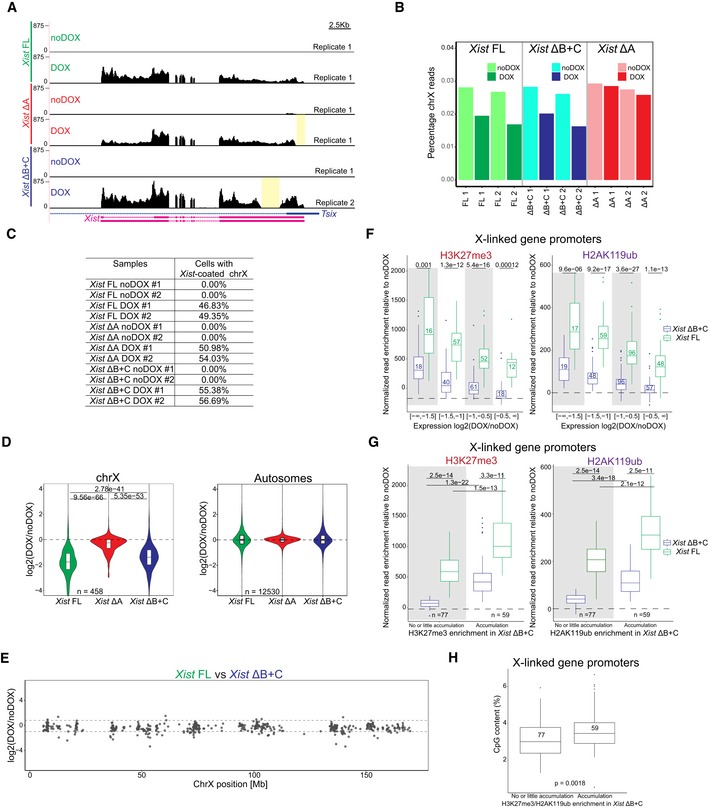
Figure EV5. Assessment of transcriptional changes by RNA‐seq in Xist FL, Xist ΔA, and Xist ΔB+C‐induced cells.

-
AGenome browser plots showing RNA‐seq reads on Xist/Tsix genes for Xist FL, Xist ΔA, and Xist ΔB+C mutants in DOX and noDOX conditions at day 2 of differentiation; yellow boxes display the deleted regions in both Xist ΔA and Xist ΔB+C.
-
BBarplot representing percentages of RNA‐seq reads mapping on X chromosome (chrX) in each sample.
-
CTable showing the percentage of cells exhibiting an Xist‐coated chrX for the different duplicates of Xist FL, Xist ΔA, and Xist ΔB+C in DOX and noDOX conditions as determined by Xist RNA FISH; at least 500 cells were counted to estimate the percentage of cells with a Xist‐coated chrX.
-
DViolin plots displaying the distribution of the average log2(fold change) in gene expression between DOX and noDOX conditions on chrX and autosomes in Xist FL, Xist ΔA, and Xist ΔB+C after normalization for the percentage of cells with a Xist‐coated chrX; the horizontal band is the median of the values, and the lower and upper hinges correspond to the 25th and 75th percentiles; n = indicates the number of genes analyzed; P‐values for chrX were calculated using a paired Wilcoxon test.
-
EPlots display the comparison of log2(fold change) in X‐linked gene silencing upon DOX induction between Xist FL and Xist ΔB+C at day 2 of differentiation; Limma t‐test did not find any gene differentially expressed between Xist FL and Xist ΔB+C.
-
FBox plots displaying the normalized read enrichment at promoters for H3K27me3 and H2AK119ub upon DOX induction for distinct categories of X‐linked genes with different degrees of gene silencing between DOX and noDOX conditions in both Xist FL and Xist ΔB+C; the horizontal band of the box plot is the median of the values, the lower and upper hinges correspond to the 25th and 75th percentiles, the upper whisker extends from the hinge to the largest value not further than 1.5 interquartile range from the hinge, and the lower whisker extends from the hinge to the smallest value at most 1.5 interquartile range of the hinge; P‐values were calculated using a Wilcoxon test; numbers inside the box plots indicate the number of genes analyzed.
-
GBox plots displaying H3K27me3 and H2AK119ub normalized enrichment levels at promoters upon induction in two categories of X‐linked genes: with no or little accumulation versus with accumulation of these PcG marks in induced Xist ΔB+C cells; the horizontal band of the box plot is the median of the values, the lower and upper hinges correspond to the 25th and 75th percentiles, the upper whisker extends from the hinge to the largest value not further than 1.5 interquartile range from the hinge, and the lower whisker extends from the hinge to the smallest value at most 1.5 interquartile range of the hinge; P‐values were calculated using a Wilcoxon test; n = indicates the number of genes analyzed.
-
HBox plots displaying the CpG content of promoters that accumulate or not H3K27me3/H2AK119ub between noDOX and DOX conditions in Xist ΔB+C at day 2 of differentiation; the horizontal band of the box plot is the median of the values, and the lower and upper hinges correspond to the 25th and 75th percentiles; the upper whisker extends from the hinge to the largest value not further than 1.5 interquartile range from the hinge, and the lower whisker extends from the hinge to the smallest value at most 1.5 interquartile range of the hinge; P‐values were calculated using a Wilcoxon test; numbers inside the box plots indicate the number of promoters analyzed.
Source data are available online for this figure.
