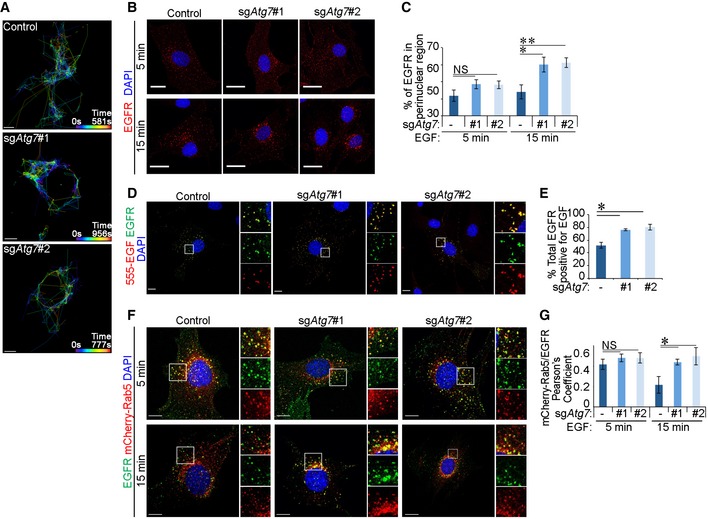
The following experiments were performed in glial sh
Nf‐1/sh
Tp53 glial cells serum starved for 4 h before assaying. Cells were expressing either Cas9 alone (control) or Cas9 and sgRNA targeting
Atg7 (sg
Atg7 #1 or #2).
Spinning disc confocal live cell imaging of Alexa 555‐EGF (555‐EGF) shown as vesicle tracking with time represented as a colour spectrum. Tracking started 5 min after addition of 20 ng/ml 555‐EGF for the indicated durations. Scale bar: 10 μm.
Immunofluorescence staining of EGFR following 5‐ or 15‐min stimulation with 20 ng/ml EGF. Scale bar: 20 μm.
Quantification of EGFR vesicles in a perinuclear region (within 30 μm diameter of the centre of the nucleus) (in B).
Cells were stimulated with 20 ng/ml 555‐EGF for 15 or 30 min before immunofluorescence staining against EGFR. Scale bar: 10 μm.
Quantification of percentage of total EGFR vesicles that colocalise with 555‐EGF (in D).
Cells stably expressing mCherry‐Rab5 were stimulated with 20 ng/ml EGF for indicated times before immunofluorescence staining against EGFR. Scale bar: 10 μm.
Pearson's colocalisation coefficient between mCherry‐Rab5 and EGFR (in F).
Data information: Statistical analyses were performed on at least three independent experiments, where error bars represent SEM and
P values represent a two‐tailed Student's
t‐test: NS
P > 0.05, *
P < 0.05, **
P < 0.01.

