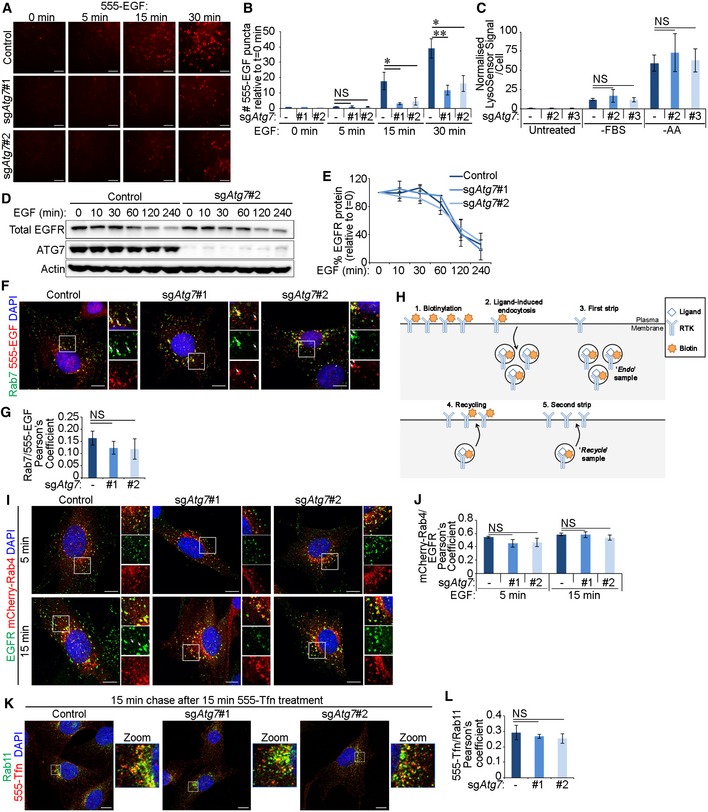
glial cells serum starved for 4 h before assaying. Cells were expressing either Cas9 alone (control) or Cas9 and sgRNA targeting
#1 or #2).
Cells were treated with 20 ng/ml Alexa 555‐EGF (555‐EGF) for the indicated times before fixation. 555‐EGF was detected using the ImageXpress high‐content imaging platform, and representative images of 555‐EGF are shown. Scale bar: 100 μm.
Following high‐content imaging of 555‐EGF and DAPI, 555‐EGF uptake relative to cell number was quantified and made relative in each cell line to background readings from unstimulated cells (t = 0 min) (in A).
Control or sgAtg7 glial shNf‐1/shTp53 cells were either untreated, serum starved (‐FBS) for 4 h, or amino acid starved (‐AA) for 2 h and LysoSensor probe added for 1 h. Shown are quantifications of LysoSensor fluorescence intensity per cell normalised to untreated control cells.
Cells were stimulated with 20 ng/ml EGF for the indicated times before EGFR levels were analysed by Western blotting.
Densitometry analyses of Western blotting showing EGFR degradation with measurements made relative to EGFR levels in unstimulated cells (t = 0 min) (in D).
Cells were stimulated with 20 ng/ml 555‐EGF for 15 min before immunofluorescence staining against endogenous Rab7. White arrows indicate colocalisation. Scale bar: 10 μm.
Quantification of Pearson's colocalisation coefficient between 555‐EGF and Rab7 (in F).
Schematic representation of cell surface protein biotinylation assay to assess endocytosis and recycling rates (see Fig
6C and D).
Cells stably expressing mCherry‐Rab4 were stimulated with 20 ng/ml EGF for 5 or 15 min and then fixed and stained by immunofluorescence against EGFR. White arrows indicate colocalisation. Scale bar: 10 μm.
Quantification of Pearson's colocalisation coefficient between mCherry‐Rab4 and EGFR (in I).
Cells were stimulated with Alexa 555‐transferrin (555‐Tfn, 20 ng/ml) for 15 min and chased with media without transferrin for 15 min. Cells were then stained by immunofluorescence against Rab11. Scale bar: 10 μm.
Quantification of Pearson's colocalisation coefficient between 555‐Tfn and Rab11 (in K).
Data information: Statistical analyses were performed on at least three independent experiments, where error bars represent SEM and
< 0.01.

