
Figure 5. TBK1 and Gal8 are required for the recruitment of autophagy machinery to early endosomes.
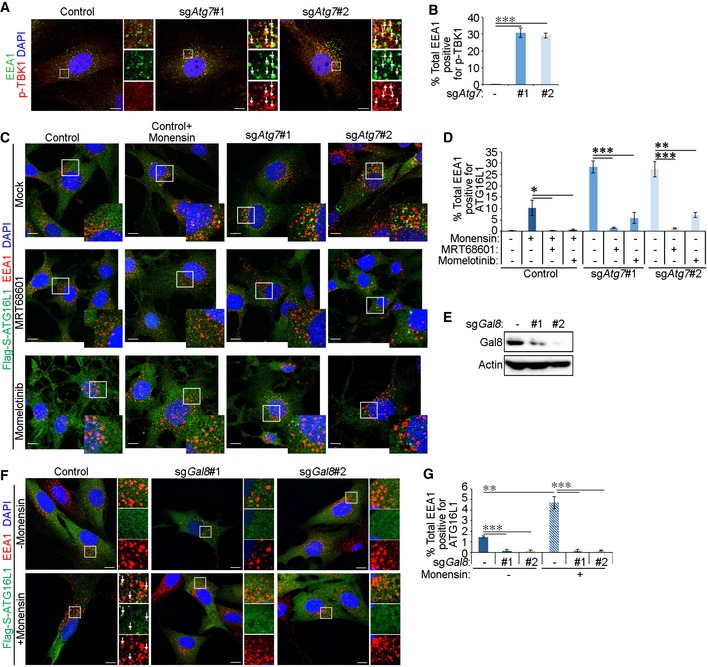
The following experiments were performed in glial shNf‐1/shTp53 glial cells serum starved for 4 h before assaying. Cells were expressing either Cas9 alone (control) or Cas9 and sgRNA targeting Atg7 (sgAtg7 #1 or #2).
- Cells were treated for 15 min with 2 ng/ml EGF before fixation and immunofluorescence staining against EEA1 and p‐TBK1. White arrows indicate colocalisation. Scale bar: 10 μm.
- Quantification of percentage of total EEA1 vesicles that colocalise with p‐TBK1 (in A).
- Cells stably expressing Flag‐S‐ATG16L1 were pre‐treated for 1 h with TBK1 inhibitors (100 μM MRT68601 or 5 μM momelotinib). Control cells were also treated 100 μM monensin for 1 h as indicated. All cells were stimulated for 15 min with 2 ng/ml EGF followed by fixation and immunofluorescence staining against Flag tag and EEA1. Scale bar: 10 μm.
- Quantification of total EEA1 vesicles that colocalise with Flag‐S‐ATG16L1 (in C).
- Western blotting of shNf‐1/shTp53 glial cells expressing gRNA sequences targeting Gal8.
- Control and sgGal8 cells stably expressing Flag‐S‐ATG16L1 were treated 100 μM monensin for 1 h and stimulated with 2 ng/ml EGF for 15 min before fixation and immunofluorescence staining against EEA1 and Flag tag. White arrows indicate colocalisation. Scale bar: 10 μm.
- Quantification of percentage of total EEA1 vesicles that colocalise with Flag‐S‐ATG16L1 in sgGal8 cells (in F).