-
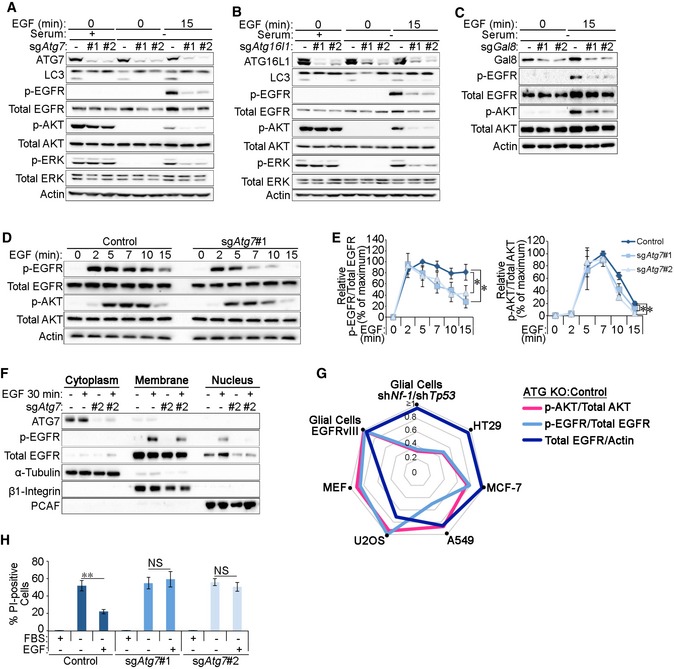
A–C
Glial shNf‐1/shTp53 sgAtg7 (A), sgAtg16l1 (B) or sgGal8 (C) cells were either left untreated (+serum) or serum starved (−serum) for 4 h and then stimulated 2 ng/ml EGF for 15 min before analyses by Western blotting.
-
D
Glial shNf‐1/shTp53 control and sgAtg7 cells were serum starved for 4 h and then stimulated with 2 ng/ml EGF for the indicated times before analysis of EGFR signalling pathway activity by Western blotting.
-
E
Phosphorylated:total protein ratios for EGFR and AKT calculated from densitometry analyses of Western blots were made relative to their respective points of maximal stimulation (100%) (for EGFR: t = 5 min in control cells and for AKT: t = 7 min in control cells) (in D).
-
F
Glial shNf‐1/shTp53 control and sgAtg7 cells were serum starved for 4 h with or without 20 ng/ml EGF 30‐min stimulation before subcellular fractionation and analysis by Western blotting.
-
G
Radar chart indicating the relative levels of pAKT (pink line), pEGFR (light blue line) or total EGFR levels (dark blue line), in autophagy‐deficient cell lines relative to their control counterparts. The following knockouts were introduced: glial cells (sgAtg7), HT29 (crATG7), MCF‐7 (sgATG5), A549 (sgATG5), U2OS (sgATG5) and MEFs (Atg16l1
−/−).
-
H
Control or sgAtg7 glial shNf‐1/shTp53 cells were serum starved for 24 h in the presence or absence of 20 ng/ml EGF. Quantification of the percentage of propidium iodide (PI)‐positive cells is shown.
Data information: Statistical analyses were performed on at least three independent experiments, where error bars represent SEM and
< 0.01.