
Figure EV2. Binding of DFL to CXCL12 assessed by NMR and MST .
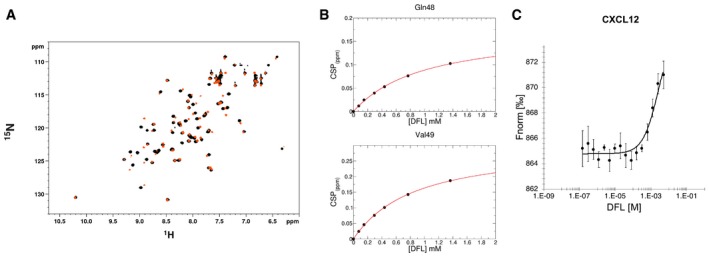
- Superposition of 1H‐15N HSQC spectra of CXCL12 (˜0.1 mM, pH 6, phosphate buffer) without (black) and with 10‐fold excess of DFL (orange).
- Weighted average of Q48 and V49 amide 1H and 15N chemical shift changes in the presence of increasing concentration of DFL. Nonlinear curve fitting yields K d = 802 ± 102 μM.
- Dose–response curve of CXCL12‐DFL interaction followed by MST. DFL concentrations ranged from 5 mM to 153 nM on 50 nM labeled 6His‐CXCL12. The K d is 2.6 ± 1.2 mM (n = 3, error bars correspond to SD). Saturation of the curve could not be reached because of solubility issues for DFL stock solutions > 10 mM. (Fnorm = normalized fluorescence).
Source data are available online for this figure.