
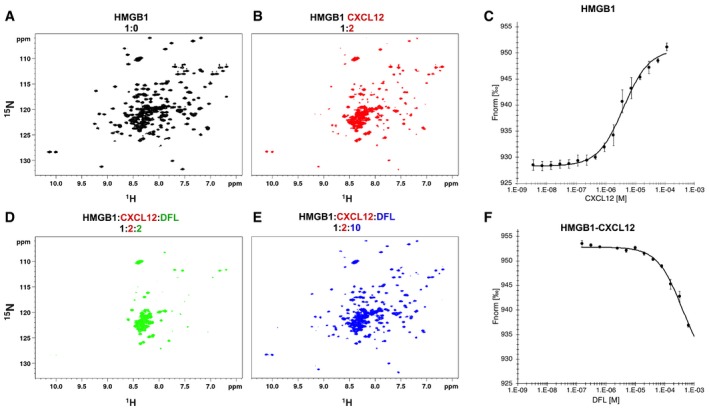
Figure 3. Effect of DFL on the HMGB1/CXCL12 heterocomplex.
-
A, B1H‐15N HSQC HMGB1 (0.1 mM) spectrum (A) without (black) and (B) with 0.2 mM CXCL12.
-
CMST measurements of CXCL12 titrated into 50 nM fluorescently labeled HMGB1; the signal increases from ˜930 (free) to ˜950 a.u. (bound) yielding an apparent K d of 4 ± 0.4 μM. n = 3; data represent avg ± SD.
-
D, EH‐15N HSQC of HMGB1 (0.1 mM) with CXCL12 (0.2 mM) upon addition of (D) 0.2 mM and (E) 1 mM DFL.
-
FMST measurements of the heterocomplex (preformed using 50 nM HMGB1 and 50 μM CXCL12) in the presence of increasing concentrations of DFL. Decreasing MST signal (from ˜950 to ˜930 a.u.) upon DFL titration indicates that CXCL12 has been displaced from HMGB1. n = 3; data represent avg ± SD.
Source data are available online for this figure.