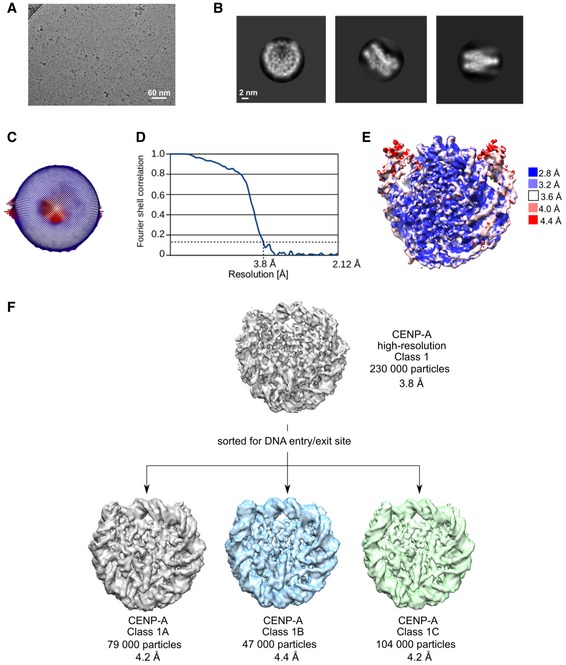
Figure EV2. Cryo‐EM analysis of CENP‐A nucleosome.

- Representative cryo‐EM raw micrograph.
- Subset of selected 2D class averages.
- Euler angle distribution of particles used in the final 3D reconstruction.
- Fourier shell correlation (FSC) curves of the final density map (CENP‐A high resolution).
- Local resolution of the final 3D density map.
- Particles used for the high‐resolution CENP‐A map were further classified for DNA entry/exit site in order to highlight differences at this part of the nucleosome. Gray map (Class 1A) has loosest DNA wrap, and green map (Class 1C) has tightest DNA wrap. The blue map represents particles that were in‐between two extreme conformations.
