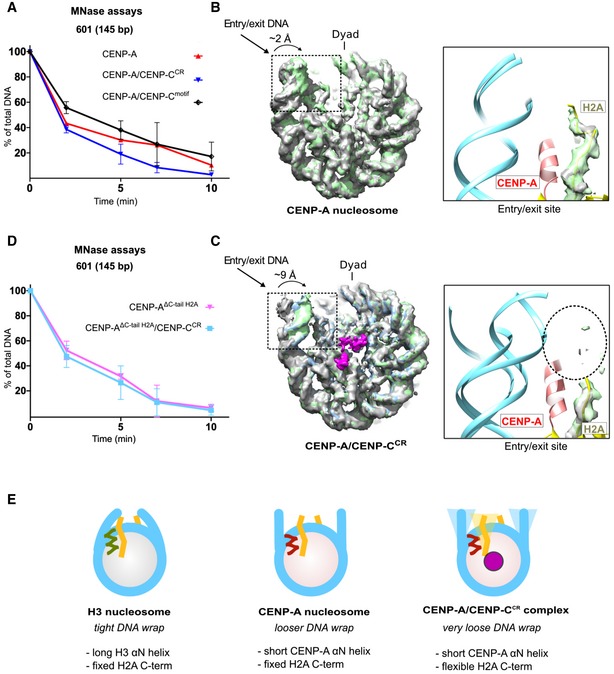
Figure 4. The C‐terminus of H2A is destabilized in the CENP‐A/CENP‐CCR complex.

- Graph showing the relative abundance of undigested DNA (145 bp) as a function of time during digestion with micrococcal nuclease (MNase) for the CENP‐A nucleosome (red), the CENP‐A/CENP‐CCR complex (blue), and the CENP‐A/CENP‐Cmotif complex (black).
- Overlay of three cryo‐EM maps (gray, blue, and green) of the CENP‐A nucleosome obtained by sorting on the DNA entry/exit site (Fig EV2F). Distance between most open (gray) and most closed (green) map is 2 Å. The entry/exit site is boxed, and the corresponding model is shown on the right. Note that the density of the H2A C‐terminus is well defined.
- Overlay of three cryo‐EM maps (gray, blue, and green) of the CENP‐A/CENP‐CCR complex obtained by sorting on the DNA entry/exit site (Fig EV4F). The distance between the most open (gray) and most closed (green) maps is 9 Å. Map assigned to CENP‐CCR is shown in magenta. The entry/exit site is boxed, and the corresponding model is shown on the right. Note the absence of a clearly defined density of the H2A C‐tail (indicated by the dotted circle).
- Same type of data as in (A) for the CENP‐A nucleosome assembled with tailless H2A (H2A, 1–109) alone (pink) and in complex with CENP‐CCR (light blue).
- Schematic representation of the interplay between the N‐terminus of H3 or CENP‐A and the C‐terminus of H2A in regulating flexibility of nucleosomal DNA wrap. DNA (cyan); longer H3 αN (green); shorter CENP‐A αN (red); H2A C‐terminus (yellow); CENP‐C (magenta).
