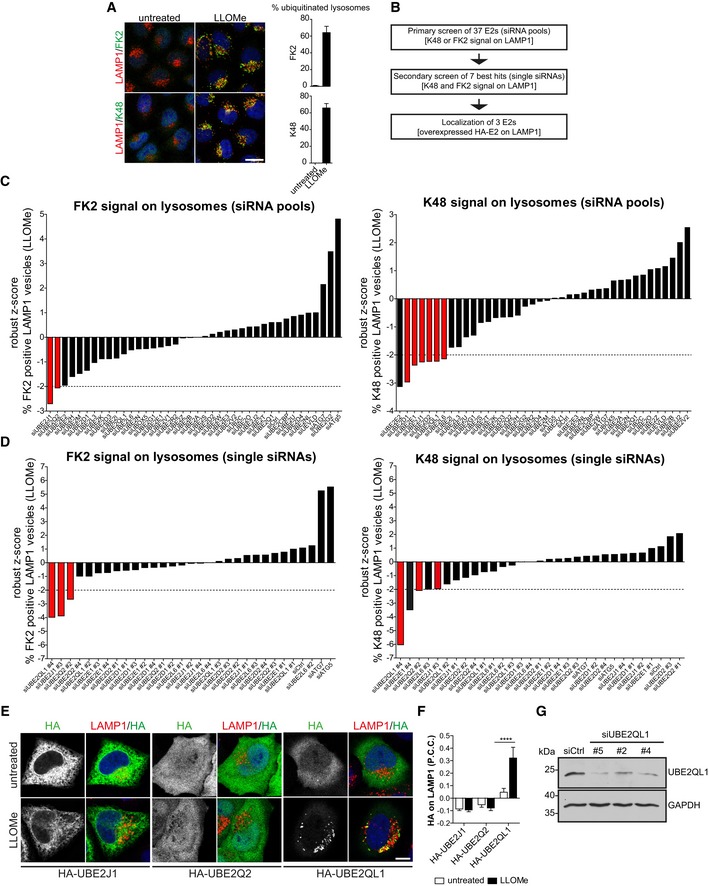
Figure 1. Microscopy‐based siRNA screen of human E2 ubiquitin‐conjugating enzymes identifies UBE2QL1 to be required for ubiquitination of damaged lysosomes.

- Robust immunofluorescence detection of ubiquitination on LAMP1‐positive compartments with pan‐ubiquitin FK2 or K48 chain‐specific antibodies. HeLa cells were treated with 250 μM LLOMe or EtOH (untreated) for 3 h, fixed, and stained with indicated antibodies. Confocal microscopy was followed by automated image analysis. Graphs represent data from three independent experiments with ≥ 50 cells per condition (mean ± SD). Scale bar: 20 μm.
- Screen overview.
- Primary screen using pools of four single siRNAs targeting 37 human E2 enzymes. HeLa cells were seeded in 384‐well plates, transfected with a siRNA library in quadruplicates for 72 h. Cells were LLOMe‐treated and processed for imaging as in (A). Plates were imaged automatically with a spinning disk confocal microscope. Automated image analysis was done using the Acapella software, and the percentage of ubiquitinated lysosomes was determined. Robust z‐scores were calculated for LLOMe‐treated samples for each depletion against the values of the whole plate. Samples exceeding the threshold of −2 of robust z‐score (highlighted in red) were considered for the secondary screen.
- Selected candidates were re‐screened with the same work pipeline as in (C) but with the four single siRNAs of pools of each candidate from the primary screen. Candidates exceeding the threshold in both stainings are highlighted in red.
- Damage‐induced translocation of UBE2QL1 to lysosomes. The three best candidates (from D) were transiently expressed with N‐terminal HA‐tag in HeLa cells. Cells were treated with LLOMe or EtOH (untreated) for 3 h, fixed, and stained for HA and LAMP1 as indicated and imaged by confocal laser scanning microscopy. Scale bar: 10 μm.
- Automated quantification of (E). Shown are Pearson correlation coefficients (P.C.C) of HA and LAMP1 signals. Graph represents data from three independent experiments with ≥ 30 cells per condition (mean ± SD). ****P < 0.0001 (one‐way ANOVA with Bonferroni's multiple comparison test).
- Western blot detection of endogenous UBE2QL1 and depletion efficiency. Cells were transfected with control siRNA (Ctrl), two UBE2QL1 siRNAs from the screen (#2 or #4) or an additional siRNA (#5), and lysates probed with an antibody to UBE2QL1 as indicated. GAPDH was probed as loading control.
Source data are available online for this figure.
