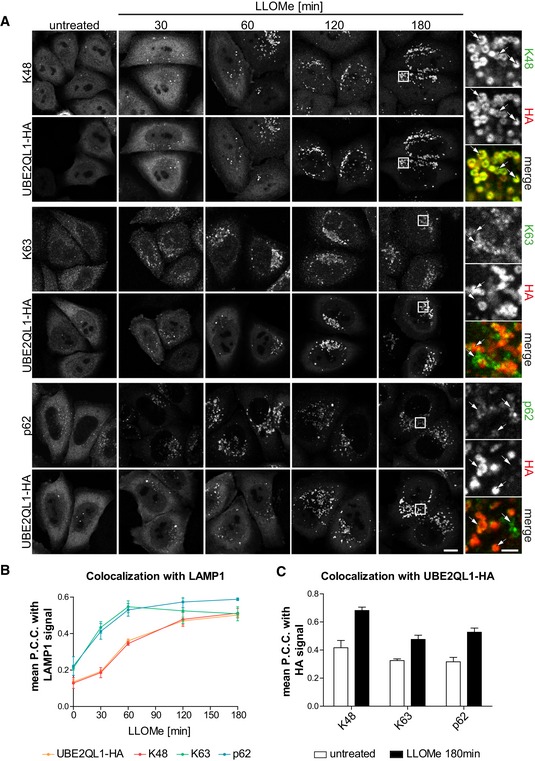
Figure 3. UBE2QL1 recruitment coincides with the delayed K48‐linked ubiquitination response.

- HeLa cells expressing UBE2QL1‐HA were fixed at indicated time points after LLOMe treatment and processed for confocal microscopy. Cells were stained with antibodies specific for LAMP1 (not shown), and combinations of HA with K48 chains, K63 chains or p62 as indicated. Note the delayed co‐emergence of K48 chains and UBE2QL1 vesicles, compared to the earlier appearance of K63 chains and p62. Arrows indicate colocalizing or non‐colocalizing vesicles. Scale bars: 10 μm, 2 μm for inlays.
- Automated quantification of (A). Shown are the Pearson correlation coefficients (P.C.C.) representing colocalization of UBE2QL1‐HA, K48 chains, K63 chains, or p62 with LAMP1‐positive vesicles. Graphs represent data from three independent experiments with ≥ 30 cells per condition (mean ± SD).
- Automated quantification of (A). P.C.C.'s representing colocalization of K48 chains, K63 chains, or p62 with UBE2QL1‐HA in cells treated with LLOMe or vehicle alone (untreated) for 180 min. Graphs represent data from three independent experiments with ≥ 30 cells per condition (mean ± SD).
