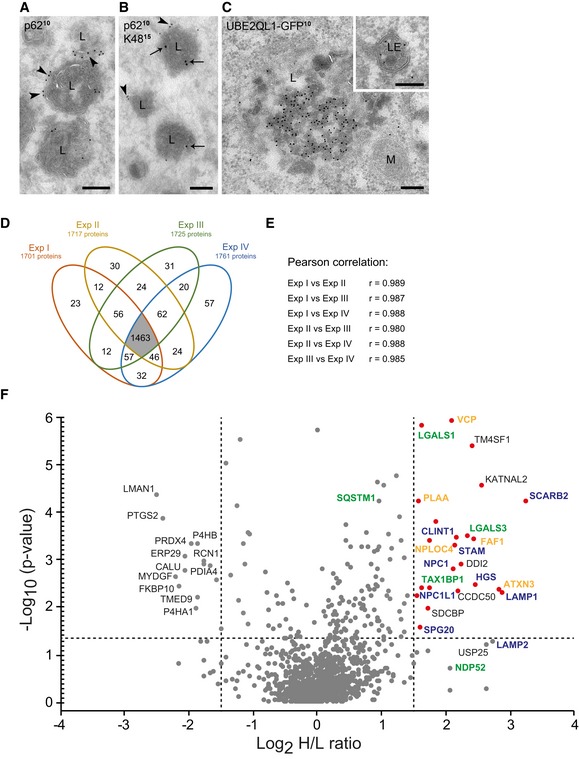
Figure 4. UBE2QL1 translocates in the vicinity of damage sensors, ubiquitination targets, and ubiquitin effectors at permeabilized lysosomes.

-
A–CImmuno‐electron microscopy of LLOMe‐treated HeLa cells. Cells in (A) and (B) overexpress mCherry‐Gal3 and a dominant‐negative C160S mutant of GFP‐YOD1 and were immunostained for p62 and K48. (A) p62 (10 nm gold particles) localizes as a cap (arrowheads) to the outer limiting membrane of lysosomes (L). (B) K48 ubiquitin chains (15 nm gold particles, arrows) are found in the lumen of lysosomes that also contain p62 (10 nm gold particles, arrowheads) at their outer membrane. (C) Overexpressed UBE2QL1‐GFP (10 nm gold particles) is found in late endosomes (LE, Inset) and lysosomes. M = mitochondrion. Scale bars: 200 nm.
-
D–FComparative UBE2QL1 proximity mapping before and after lysosome damage using SILAC mass spectrometry. HeLa cells expressing a UBE2QL1‐APEX2 fusion were EtOH (light‐labeled, L)‐ or LLOMe (heavy‐labeled, H)‐treated and pulsed with biotin phenol (30 min) and H2O2 (1 min). Proteins detected in replicative streptavidin purifications are depicted in a Venn diagram (D) and displayed high correlation coefficients (E). (F) Results from the four experiments are summarized in a volcano plot. Horizontal dotted line represents the significance threshold (P > 0.05). The vertical lines indicate the fold‐change cutoff (log2 (H/L) ≥ 1.5). Red dots indicate proteins above the significance and fold‐change thresholds. Protein names are color‐coded in blue (endosome/lysosome‐associated), green (endolysosomal damage/autophagy‐associated), and orange (VCP/p97 and its cofactors).
Source data are available online for this figure.
