
Figure EV1. Defects in outer kinetochore integrity are specific to loss of Plk1 activity (related to Fig 1).
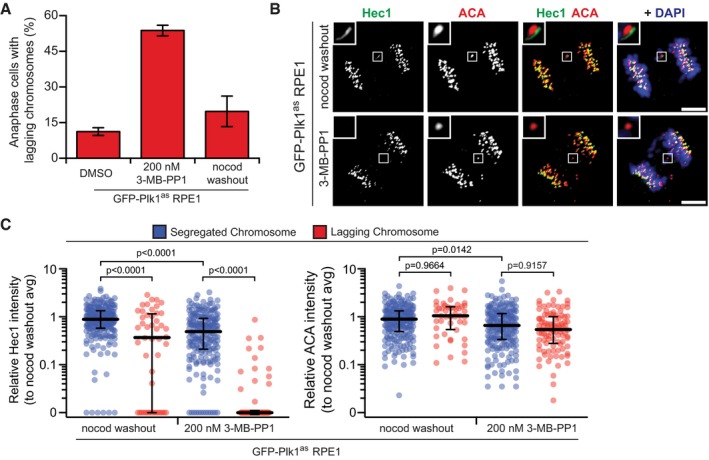
- Graph shows average percentage (± SEM) of EGFP‐Plk1as‐expressing RPE1 cells exhibiting lagging chromosomes in anaphase after Plk1as inhibition (200 nM 3‐MB‐PP1) or nocodazole washout (n = 30 cells/experiment; four independent experiments).
- Representative maximum‐intensity micrographs of anaphase cells from (A). Insets highlight presence/absence of Hec1 at lagging kinetochores, marked by ACA. Scale bars, 5 μm.
- Graph shows relative volume intensities of Hec1 (left) and ACA (right) at segregated (blue) and lagging (red) kinetochores from (A, B). Each circle represents a single kinetochore (n = 10 segregated kinetochores/cell, 1–8 lagging kinetochores/cell; eight cells/experiment; three independent experiments). Bars indicate median kinetochore intensity and interquartile range. Significance determined by Kruskal–Wallis test with Dunn's correction for multiple comparisons.