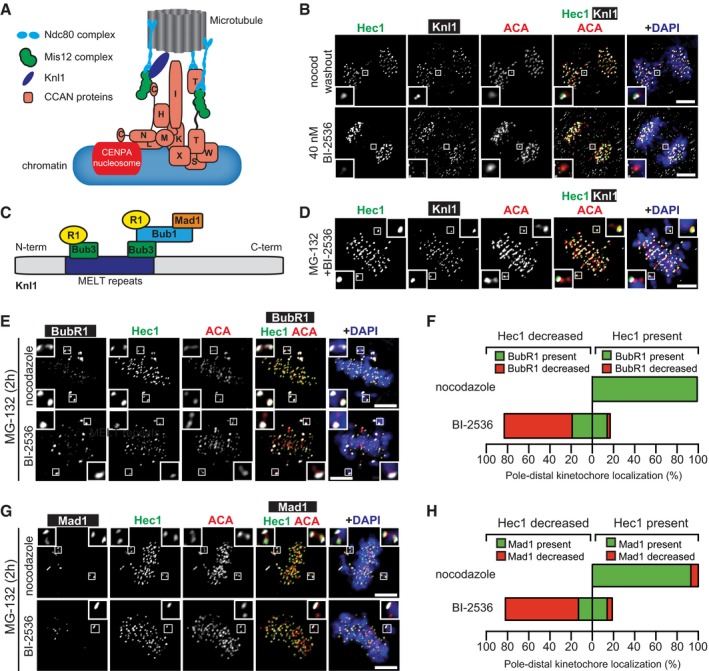
Illustrative map of the kinetochore highlighting positions of KMN (Knl1, Mis12, Ndc80) and CCAN complexes relative to microtubules and centromeric chromatin.
Representative maximum‐intensity projection micrographs of kinetochore protein localization in anaphase cells after Plk1 inhibition (BI‐2536) or nocodazole washout. Insets highlight lagging kinetochores, marked by ACA. Scale bars, 5 μm.
Illustrative diagram of Knl1 indicating method of BubR1 and Mad1 recruitment.
Representative maximum‐intensity projection micrographs of metaphase cell with misaligned chromosome pairs after 2‐h Plk1 inhibition (BI‐2536). Inset highlights decreased localization of Knl1 and Hec1 to the pole‐distal kinetochores, indicated by ACA. MG‐132 was used to prevent mitotic cells from entering anaphase. Scale bar, 5 μm.
Representative maximum‐intensity projection micrographs of metaphase cells with misaligned chromosome pair after 2‐h Plk1 inhibition (BI‐2536) or nocodazole challenge. Insets highlight distribution of BubR1 and Hec1 at misaligned kinetochore pairs, indicated by ACA. MG‐132 was used to prevent mitotic cells from entering anaphase. Scale bars, 5 μm.
Graphs show average percentage of misaligned pole‐distal kinetochores with localized (green) or decreased (red) BubR1 and Hec1 after 2‐h Plk1 inhibition (BI‐2536) or nocodazole challenge (n = 1–10 kinetochore pairs/cell; 10 cells/experiment; two independent experiments). “Decreased” intensity indicates ≤ 50% intensity of sister kinetochore.
Representative maximum‐intensity projection micrographs of metaphase cells with misaligned chromosome pair after 2‐h Plk1 inhibition (BI‐2536) or nocodazole challenge. Insets highlight distribution of Mad1 and Hec1 at misaligned kinetochore pairs, indicated by ACA. MG‐132 was used to prevent mitotic cells from entering anaphase. Scale bars, 5 μm.
Graphs show average percentage of misaligned pole‐distal kinetochores with localized (green) or decreased (red) Mad1 and Hec1 after 2‐h Plk1 inhibition (BI‐2536) or nocodazole challenge (n = 1–10 kinetochore pairs/cell; 10 cells/experiment; two independent experiments). “Decreased” intensity indicates ≤ 50% intensity of sister kinetochore.

