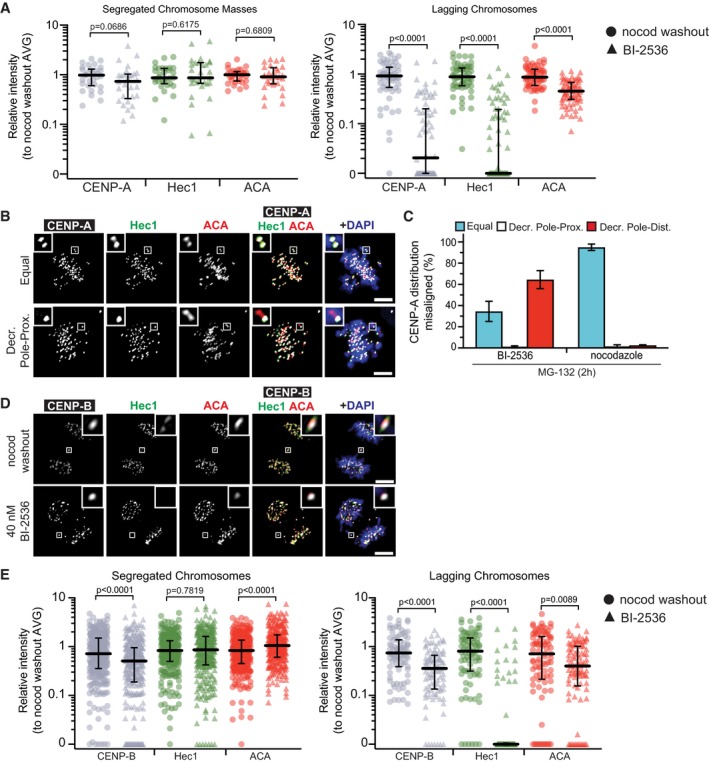
Figure EV3. Kinetochore disruption after Plk1 inhibition includes CENP‐A, but not CENP‐B (related to Fig 3).

- Graph shows relative volume intensities of CENP‐A (gray), Hec1 (green), and ACA (red) at segregated (left) and lagging (right) kinetochores after Plk1 inhibition or nocodazole washout (Fig 3E and F). Note CENP‐A data are identical to data presented in Fig 3F. Each symbol in the left graph represents all segregated kinetochores/cell (n = 10 cells/experiment; three independent experiments), whereas each symbol in the right graph represents a single kinetochore (n = 1–6 kinetochores/cell; 10 cells/experiment; three independent experiments). Bars indicate median kinetochore intensity and interquartile range. Significance determined by two‐tailed Mann–Whitney test.
- Representative maximum‐intensity projection micrographs of metaphase cells with misaligned chromosomes. Insets highlight distribution of CENP‐A and Hec1 at misaligned kinetochore pair, indicated by ACA. Scale bars, 5 μm.
- Graph shows average percentage (± SEM) of misaligned chromosome pairs exhibiting each of the three distribution types after 2‐h Plk1 inhibition (BI‐2536) or nocodazole challenge (n = 1–8 chromosomes/cell; 10 cells/experiment; two independent experiments). “Decreased” intensity indicates ≤ 50% intensity of sister kinetochore.
- Representative maximum‐intensity micrographs of anaphase cells after Plk1 inhibition (BI‐2536) or nocodazole washout. Insets highlight the presence of CENP‐B and Hec1 at lagging kinetochores, marked by ACA. Scale bars, 5 μm.
- Graph shows relative volume intensities of CENP‐B (gray), Hec1 (green), and ACA (red) at segregated (left) and lagging (right) kinetochores from (B). Each symbol represents a single kinetochore (n = 10 segregated kinetochores/cell, 1–8 lagging kinetochores/cell; 10 cells/experiment; three independent experiments). Bars indicate median kinetochore intensity and interquartile range. Significance determined by two‐tailed Mann–Whitney test.
