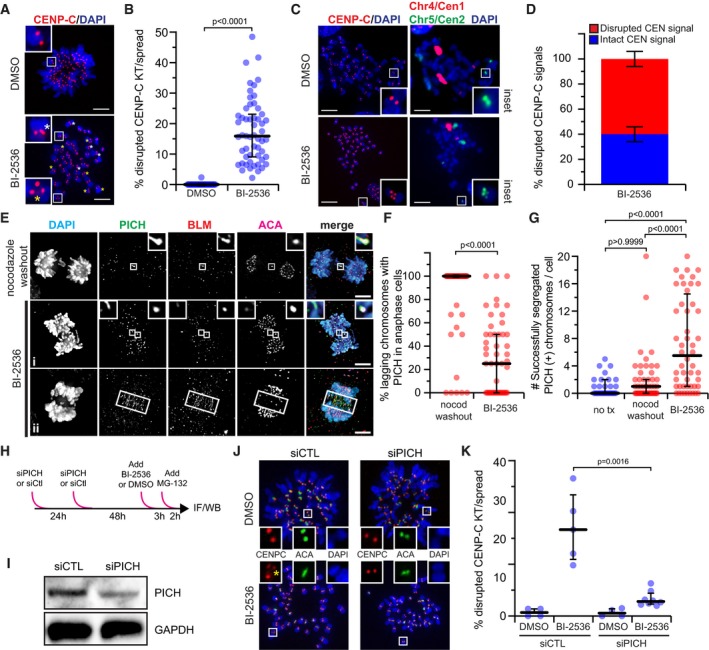
Representative maximum‐intensity projection micrographs of metaphase spreads after Plk1 inhibition (25 nM BI‐2536) or control (DMSO). Insets highlight kinetochore pairs that are intact (top), elongated (white asterisk), or fragmented (yellow asterisk). Scale bar, 5 μm.
Graph shows percentage of kinetochore pairs/spread exhibiting disrupted CENP‐C from (A). Each circle represents a spread (n ≥ 30 spreads from five independent experiments). Bars indicate median kinetochore intensity and interquartile range. Significance determined by two‐tailed Mann–Whitney test.
Representative maximum‐intensity projection micrographs of metaphase spreads after Plk1 inhibition (25 nM BI‐2536) or control (DMSO). Insets highlight integrity of the kinetochore (CENP‐C) and underlying centromeric chromatin (Chromosome 5, Cen2). Note multiple centromere probes used for analysis. Here, centromere probe (Cen1) of Chromosome 4 is indicated in red. Scale bar, 5 μm.
Graph shows frequency of intact (blue) or disrupted (red) CEN signals associated with disrupted CENP‐C from (C). Bars represent the average percentage (± SEM) of a minimum of 200 centromeres from two independent experiments. Impaired CENP‐C was rarely observed in DMSO control, hence its exclusion from analysis.
Maximum‐intensity projection micrographs of anaphase cells after nocodazole washout or Plk1 inhibition with 40 nM BI‐2536. Insets highlight localization of PICH and BLM to lagging kinetochores. Elongated, non‐chromatin‐associated midzone signals (ii) were rarely observed and excluded from analysis. Scale bars, 5 μm.
Graph shows percentage of cells exhibiting lagging chromosomes with PICH(+) kinetochore signals in (E). Each circle represents a cell (n = 50 cells from four independent experiments; average laggards/cell: two nocodazole washout, four BI‐2536). Bars indicate median percentage and interquartile range. Significance determined by two‐tailed Mann–Whitney test.
Graph shows number of segregated chromosomes with PICH(+) kinetochore signals observed per cell in (E). Each circle represents a cell (n = 30 cells from two independent experiments for no treatment; 50 cells from four independent experiments for nocodazole washout and BI‐2536). Bars indicate median number and interquartile range. Significance determined by Kruskal–Wallis test with Dunn's correction for multiple comparisons.
Illustrative schematic of the PICH knockdown strategy.
Immunoblot of protein extracts from RPE1 cells 72 h after PICH (25 nM) or control knockdown. Membranes probed for PICH or GAPDH (loading control).
Representative maximum‐intensity micrographs of metaphase spreads after control or PICH knockdown with (25 nM BI‐2536) or without (DMSO) Plk1 inhibition. Insets highlight integrity of a kinetochore pair. Yellow asterisk denotes fragmented CENP‐C.
Graph shows frequency of kinetochore pairs/spread exhibiting disrupted CENP‐C from (J) in the indicated conditions (siPICH 25 and 40 nM). Each circle represents the average frequency observed within a given experiment (n ≥ 30 spreads from 4 to 5 independent experiments). Bars indicate median kinetochore intensity and interquartile range. Significance determined by two‐tailed Mann–Whitney test.