-
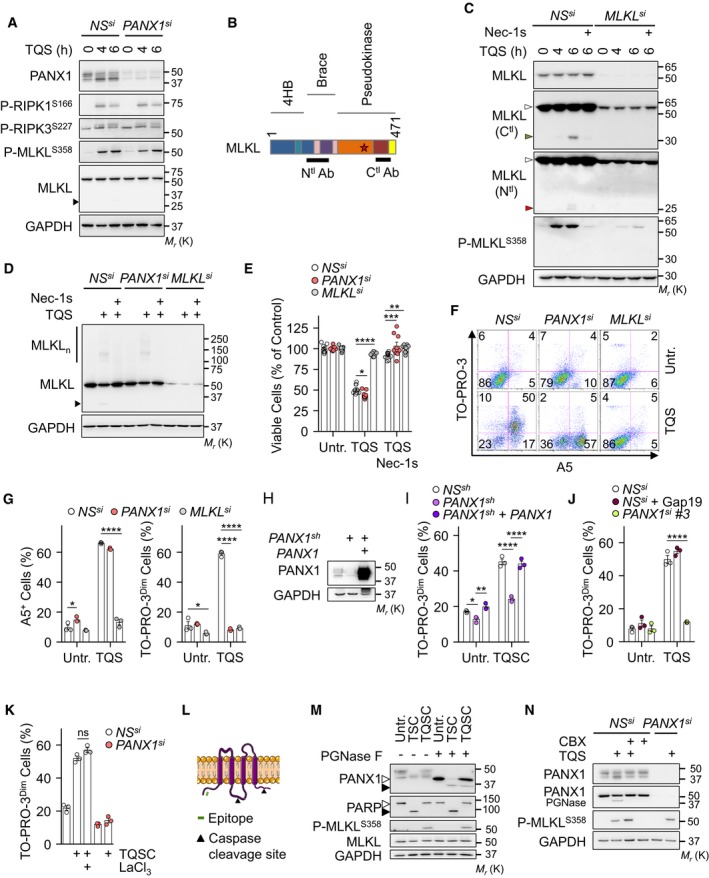
A
HT‐29 cells were transfected with a siRNA for PANX1 (#1), or scramble non‐specific (NS) siRNA for 72 h. Cells were pre‐treated with 10 μM QVD‐OPh (Q) together with 5 μM Birinapant (S), prior stimulation with 10 ng ml−1 of TNFα (T), as indicated. Cell lysates were analyzed by Western blotting, as indicated. Molecular weight markers (Mr) are shown.
-
B
Schematical representation of MLKL. The position of the epitopes recognized by the two antibodies used is shown. The star indicates the S358 position.
-
C
HT‐29 cells were treated as indicated. Necrostatin‐1 (Nec‐1s, 20 μM) was also used. Cell lysates were prepared and analyzed by Western blotting. White arrowheads show intact MLKL, and green or red arrowheads show cleaved MLKL.
-
D
Cells as in (A) were exposed to TQS for 5 h. Necrostatin‐1 (Nec‐1s, 20 μM) was also used. MLKL oligomers (MLKLn) were resolved by non‐reducing SDS–PAGE after cross‐linking.
-
E
Cell viability assay by CellTiter‐Glo in cells treated with TQS for 24 h (mean ± SEM, n = 9 biological replicates, *P < 0.1, **P < 0.01, ***P < 0.001, ****P < 0.0001, ANOVA).
-
F, G
Cells were treated with TQS for 4 h, stained with TO‐PRO‐3 and Annexin V (A5), and analyzed by flow cytometry. Dead cells (TO‐PRO‐3high) were not analyzed. Data are means ± SEM of three independent experiments. *P < 0.1, ****P < 0.0001 (ANOVA).
-
H, I
HT‐29 cells were infected with a lentivirus containing a shRNA targeting PANX1 in the 5′‐UTR region. PANX1 was reintroduced after an infection with a lentivirus containing a PANX1 cDNA. Cell lysates were analyzed by Western blotting (H). Flow cytometric analysis of cells treated with TQS and cycloheximide for 4 h and stained with TO‐PRO‐3 (I). Data are means ± SEM of three independent experiments. *P < 0.1, **P < 0.01, ****P < 0.0001 (ANOVA).
-
J, K
TO‐PRO‐3 uptake was analyzed by flow cytometry (mean ± SEM, n = 3 biological replicates, ****P < 0.0001, ANOVA). Gap19 (20 μM) and LaCl3 (1.5 mM) were used.
-
L
Schematical representation of PANX1. The position of the epitopes recognized by the antibodies used and the cleavage sites by caspases are shown.
-
M
Western blotting analysis as indicated. PGNase F was used to remove glycosylation. Open and close symbols represent full‐length and cleaved proteins, respectively.
-
N
Western blotting analysis as indicated. The presented data are representative of at least three independent experiments.
Data information: (A, D) The arrowhead indicates MLKL cleaved fragment.