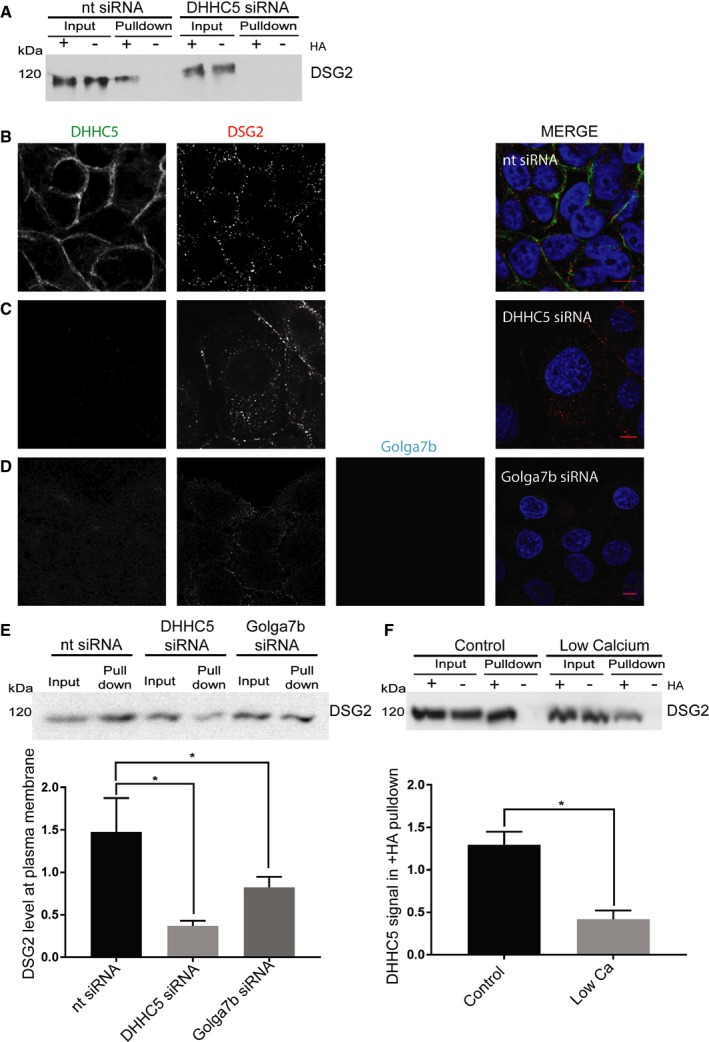
ABE purifications from HeLa cells treated with 10 nM non‐targeting siRNA (nt siRNA) or DHHC5 siRNA were immunoblotted for Dsg2. Loss of the band in the +HA pull‐down in the DHHC5 siRNA condition shows that Dsg2 palmitoylation is dependent on DHHC5.
Confocal images of DHHC5 and Dsg2 in nt siRNA‐treated A431 cells 3 h after calcium was reintroduced to the medium in calcium switch experiments.
Confocal images of DHHC5 and Dsg2 in DHHC5‐depleted A431 cells 3 h after calcium was reintroduced to the medium in calcium switch experiments.
Confocal images of DHHC5, Dsg2 and Golga7b in Golga7b‐depleted A431 cells 3 h after calcium was reintroduced to the medium in calcium switch experiments.
Immunoblots and quantification of Dsg2 pulled down in cell surface biotinylation assays in nt siRNA, DHHC5 siRNA or Golga7b siRNA treated conditions. Quantification of the intensity of the Dsg2 signal in the pull‐down is normalised to input. A significant reduction of cell surface Dsg2 occurs when DHHC5 or Golga7b is depleted by siRNA. *P < 0.05, paired t‐test. N = 4; error bars represent SEM.
Immunoblot of an ABE purification for Dsg2 in cells with either normal medium or low‐calcium (5 μM calcium) medium, with quantification of the intensity of the DSG2 signal in the pull‐down normalised to input. There is a significant reduction in the Dsg2 signal in the +HA pull‐down from low‐calcium cells, showing that Dsg2 is significantly less palmitoylated in this condition. *P < 0.05, paired t‐test, N = 4; error bars represent SEM.
Data information: All scale bars: 10 μm. See Appendix Fig S6 for quantification of data in panels (B–D).

