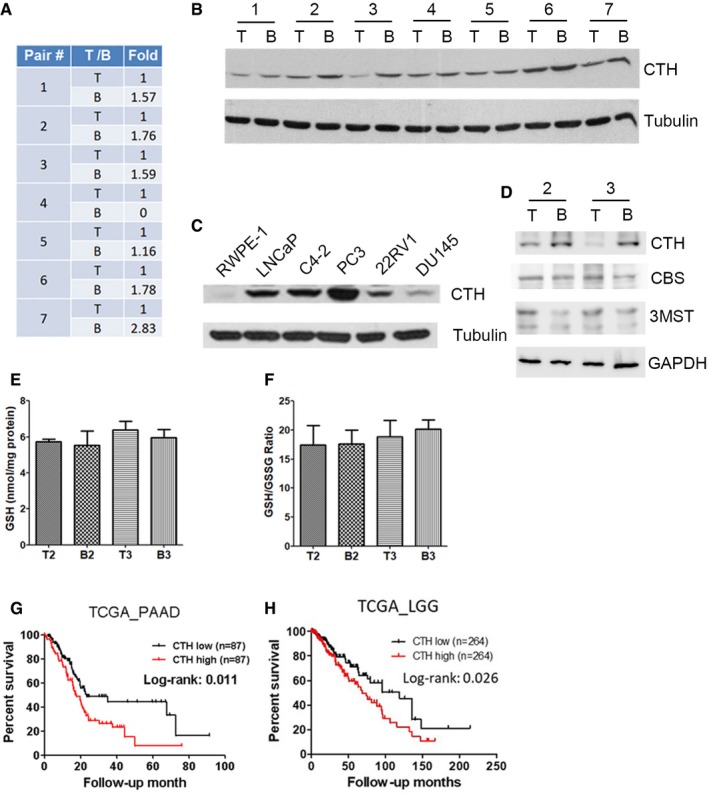
Figure EV1. CTH level is elevated in metastatic prostate cancer cells and correlates with poor survival in other cancer types.

-
AMicroarray analysis showing CTH mRNA expression in seven pairs of PC3 cells grown in bone marrow (B line), compared to cells grown in the orthotopic implanted prostate tumor (T line). The fold changes indicated each T line to B line of CTH expression.
-
BWestern blot analysis of CTH expression in seven pairs of PC3‐B lines and PC3‐T lines.
-
CWestern blot analysis of CTH expression in prostate normal epithelial cells, RWPE‐1, together with five prostate cancer cells, including LNCaP, C4‐2, PC3, 22RV1, and DU145 cells.
-
DWestern blot analysis of CTH, CBS, and 3MST expression in PC3‐T2, PC3‐B2, PC3‐T3, and PC3‐B3 lines.
-
E, FTotal glutathione (GSH) content and the ratio of reduced glutathione to oxidized glutathione (GSH/GSSG). Cells were seeded at a density of 5 × 10³ cells per 96‐well plate overnight; then, cells were lysed to measure the GSH and GSSG levels. Data indicate total glutathione concentration normalized to total protein content (E) and the ratio of GSH to GSSG normalized to total protein content (F). Data shown represent the normalized means ± SD (n = 3 biological replicates).
-
G, HAssociation of CTH expression with poor survival in pancreatic adenocarcinoma (PAAD) and lower grade glioma (LGG). Kaplan–Meier survival analysis of PAAD (G) and LGG (H) patients with high or low CTH expression. The RNA‐seq data of CTH were downloaded from the TCGA database as described in the section of Materials and Methods. The statistical significance was determined using the chi‐square test.
Source data are available online for this figure.
