-
A
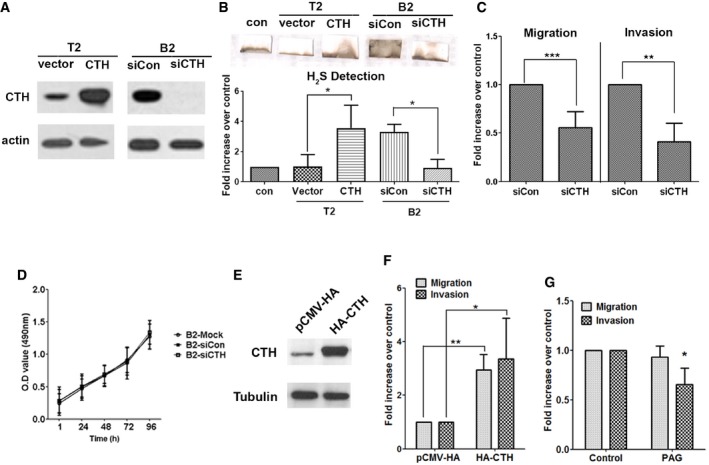
Western blot analysis of the CTH level in PC3‐T2 cells with CTH overexpression by pCMV‐CTH‐HA or PC3‐B2 cells with CTH knockdown by siCTH‐1.
-
B
Top: The H2S production capacity of cell lysates from PC3‐T2 cells with CTH overexpression by pCMV‐CTH‐HA or PC3‐B2 cells with CTH knockdown by siCTH‐1. Lead acetate‐soaked paper strips show a PbS brown stain as a result of reaction with H2S. Bottom: The level of H2S production was quantified by densitometry, and the histograms represent the means ± SD (n = 3 biological replicates). ANOVA followed by Tukey's post hoc test was used for the statistical analysis (*P < 0.05).
-
C
PC3‐B2 cells were transfected with control or siCTH‐1 and then were subjected to migration (16 h) and invasion (24 h) assays.
-
D
Cell proliferation rates of PC3‐B2 cells with CTH knockdown. Cell proliferation assay was performed by MTS reagent.
-
E
Western blot analysis of the CTH levels in PC3 cells transfected with HA‐CTH or pCMV‐HA vector control.
-
F
PC3 cells were transfected with HA‐CTH or pCMV‐HA vector control and then incubated for migration (16 h) and invasion assay (24 h).
-
G
PC3 cells were pre‐treated with 10 μM PAG for 16 h, and incubated for migration (16 h) and invasion assay (24 h) in the presence of 10 μM PAG.
Data information: (C, D, F, and G) Data shown represent the means ± SD (
n = 3 biological replicates). Student's
t‐test was used for the statistical analysis (*
P < 0.05; **
P < 0.01; ***
P < 0.001).
Source data are available online for this figure.

