-
A
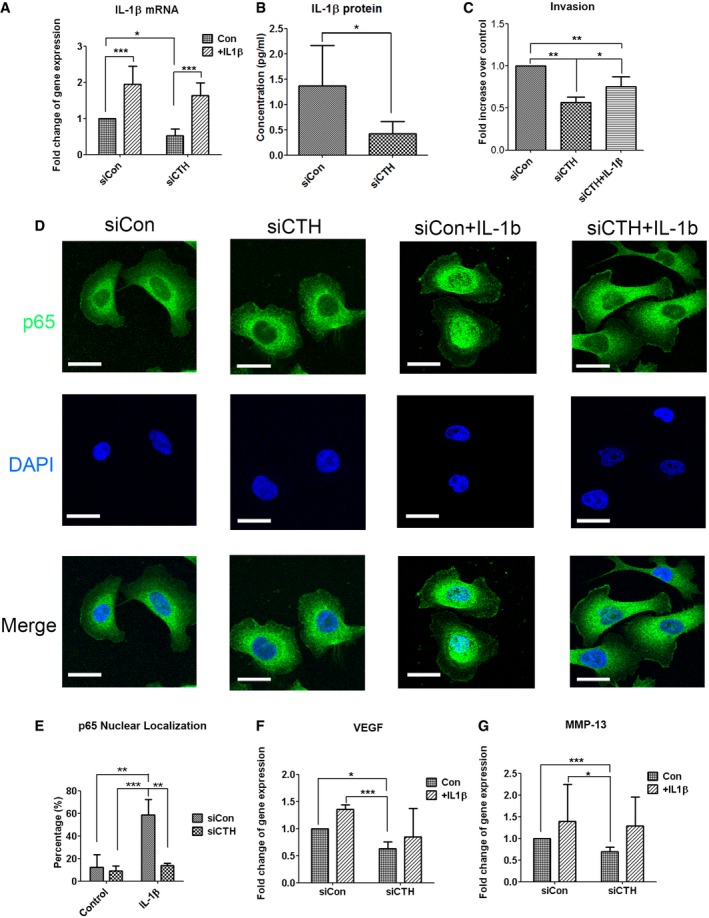
Real‐time RT–PCR analysis for IL‐1β mRNA levels in PC3 cells with control or CTH knockdown. Recombinant IL‐1β (10 ng/ml) was added for 24 h in serum‐free medium.
-
B
ELISA assay for IL‐1β protein level in the culture medium of PC3 cells with control or CTH knockdown.
-
C
PC3 cells transfected with control or CTH knockdown were incubated for invasion (24 h) assay with recombinant IL‐1β (10 ng/ml) added to the medium of the lower chamber.
-
D
PC3 cells transfected with control or CTH siRNA were exposed to IL‐1β (20 ng/ml) for 1 h. Subcellular localization of p65 was detected by immunocytochemistry. Nuclei were counterstained with DAPI. The representative images are shown. Scale bars: 25 μm.
-
E
The percent of nuclear translocation for p65 was scored by counting the number of nuclear positive stained cells of p65 to the total number of cells in random microscopic fields.
-
F, G
Real‐time RT–PCR analysis for VEGF (F) and MMP‐13 (G) mRNA level in PC3 cells with control or CTH knockdown. Recombinant IL‐1β (10 ng/ml) was added for 24 h in serum‐free medium.
Data information: All data shown (A–C and E–G) represent the means ± SD (
n = 3 biological replicates). Student's
t‐test (B) or ANOVA followed by Tukey's post hoc test (A, C, and E–G) was used for the statistical analysis. (*
P < 0.05; **
P < 0.01; ***
P < 0.001).

