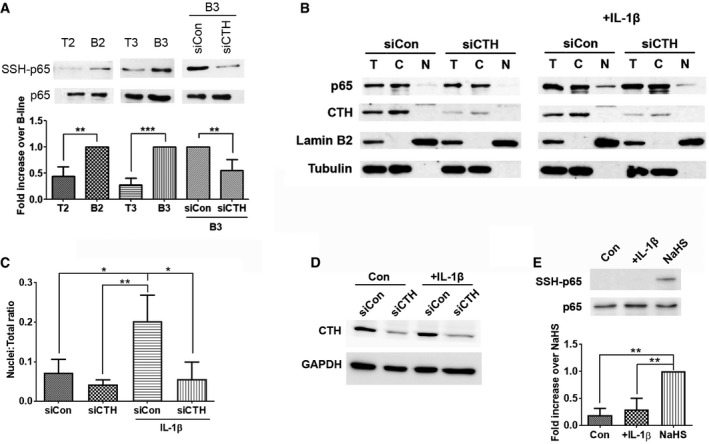
Figure EV3. Knockdown of CTH decreases IL‐1β‐stimulated p65 nuclear translocation.

-
AUpper: PC3‐T2, PC3‐B2, PC3‐T3, PC3‐B3 cells or PC3‐B3 cells with CTH or control siRNA transfection were subjected to the modified biotin switch assay with the antibody against p65 to detect S‐sulfhydration. Bottom: Quantitative analysis of SSH‐p65 protein level, and normalized with total p65 level. Histograms represent normalized means ± SD (n = 3 biological replicates). Student's t‐test was used for the statistical analysis (**P < 0.01; ***P < 0.001).
-
BPC3 cells were treated with 20 ng/ml IL‐1β for 1 h after 48 h post‐transfection. Cells were then subject to fractionation, and the extracts from the nuclear and cytoplasmic compartments were analyzed by Western blotting using the indicated antibodies. Lamin B2 and tubulin serve as the marker of the nuclear and cytoplasmic compartments, respectively. T: total, N: nuclear fraction, and C: cytoplasmic fraction.
-
CQuantitative analysis of the cellular fractionation results from (B). The p65 nuclear protein level was normalized with p65 level in the total cell lysate. Histograms represent means ± SD (n = 3 biological replicates). ANOVA followed by Tukey's post hoc test was used for the statistical analysis (*P < 0.05; **P < 0.01).
-
DThe expression of CTH upon IL‐1β stimulation. PC3 cells were treated with 20 ng/ml IL‐1β for 24 h at 48 h post‐transfection with siCTH. Cell lysates were then analyzed by Western blotting using an antibody against CTH.
-
EUpper: PC3 cells treated with 20 ng/ml IL‐1β for 24 h were subjected to the modified biotin switch assay with the antibody against p65 to detect S‐sulfhydration. PC3 cells treated with 1 μM NaHS for 1 h were used as positive control. Bottom: Histograms represent normalized means ± SD (n = 3 biological replicates). ANOVA followed by Tukey's post hoc test was used for the statistical analysis (**P < 0.01).
Source data are available online for this figure.
