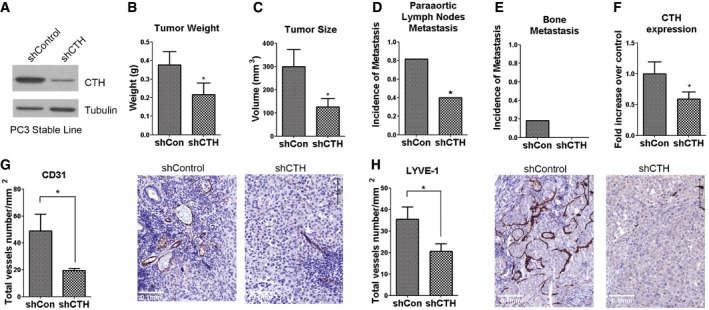
Figure 5. Knockdown of CTH suppresses tumor growth and distant metastasis in the orthotopic implantation mouse model.

-
AWestern blot analysis of the CTH expression in PC3 cells stably expressing control or CTH shRNA.
-
B–E1 × 106 PC3 cells with control or CTH knockdown were orthotopically injected into the mouse prostate for 60 days. The tumor weight (B) and tumor volume (C) were compared. Incidences of paraaortic lymph nodes metastasis (D) and bone metastasis (E) are shown. Data are presented as means ± SEM (n = 10 mice per group).
-
FReal‐time RT–PCR analysis for CTH mRNA levels in PC3 orthotopic tumors from shCon or shCTH group. Data shown represent normalized means ± SEM (n = 10 mice per group).
-
G, HImmunohistochemical analysis of paraffin‐embedded xenograft prostate tumor using CD31 (G) and LYVE‐1 (H) antibody. The total vessel number per mm2 was quantified. Scale bars: 0.1 mm. Data are presented as means ± SEM (n = 4–5 mice per group).
