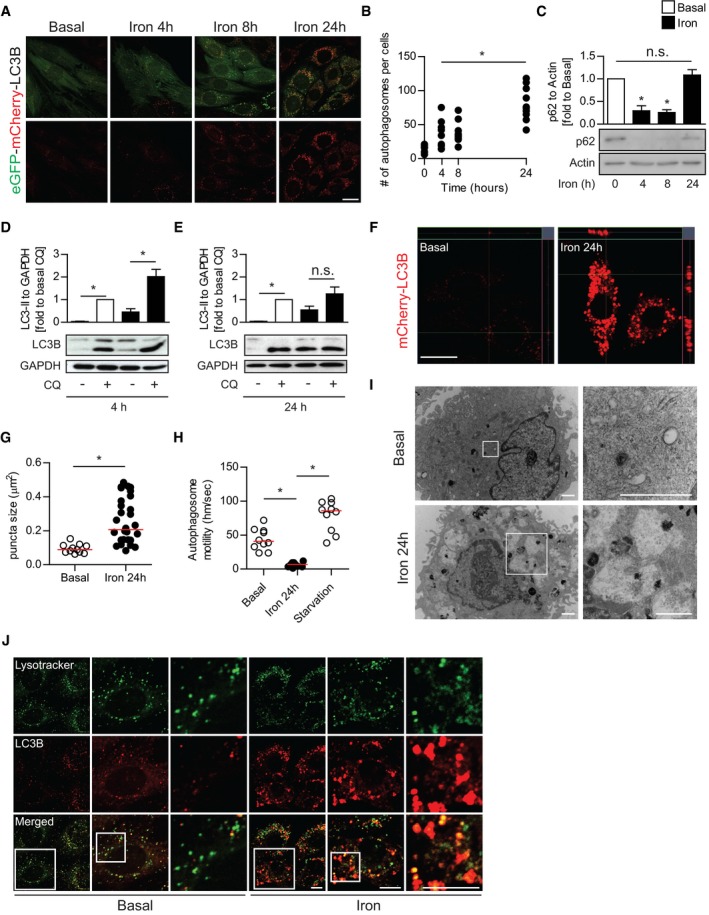
Representative confocal microscope image of L6 cells stably expressing tandem fluorescent‐eGFP‐mCherry LC3B treated with iron (FeSO4, 250 μM) for the indicated time points (4, 8, 24 h).
Quantification of mean LC3B puncta per cell from (A). Experiments were repeated three times, and one representative experiment is presented here. *P < 0.05 (one‐way ANOVA with Dunnett's post hoc test versus basal).
Representative Western blot images and quantification of p62 to actin in L6 cells after iron treatment (FeSO4, 250 μM) at multiple time points. *P < 0.05 (multiple unpaired Student's t‐test versus basal).
Representative Western blot images and quantification of LC3B‐II to GAPDH in L6 cells after 4‐h iron treatment stimulated with chloroquine (CQ, 30 μM). *P < 0.05 (unpaired Student's t‐test versus control, basal, or iron without CQ).
Representative Western blot images and quantification of LC3B‐II to GAPDH in L6 cells after 24‐h iron treatment stimulated with CQ 30 μM. *P < 0.05 (unpaired student's t‐test versus control, basal, or iron without CQ).
Representative confocal microscope z‐stack image of mCherry‐LC3B L6 cells after iron treatment (250 μM, 24 h).
Quantification of LC3B puncta size from (F). Experiments were performed three times, and one representative experiment is presented here. *P < 0.05 (unpaired Student's t‐test compared to basal).
Quantification of autophagosome motility from live cell microscopy (
Movie EV1) from mCherry‐LC3B L6 cells under basal, iron (250 μM, 24 h), and starvation (amino acid free) condition. Experiments were performed three times, and one representative experiment is presented here. *
P < 0.05 (unpaired Student's
t‐test compared to iron 24 h).
Representative TEM images of autophagosome and autolysosomes in L6 cells after iron treatment (250 μM, 24 h).
Representative confocal microscope images of eGFP‐mCherry‐LC3B L6 cells with LysoTracker Deep Red after iron treatment (250 μM, 24 h).
Data information: Data are expressed as means ± SEM. Western blot and confocal image analysis were performed three times. Scale bar (confocal microscope) = 10 μm. Scale bar (electron microscope) = 1 μm.

