Figure 2.

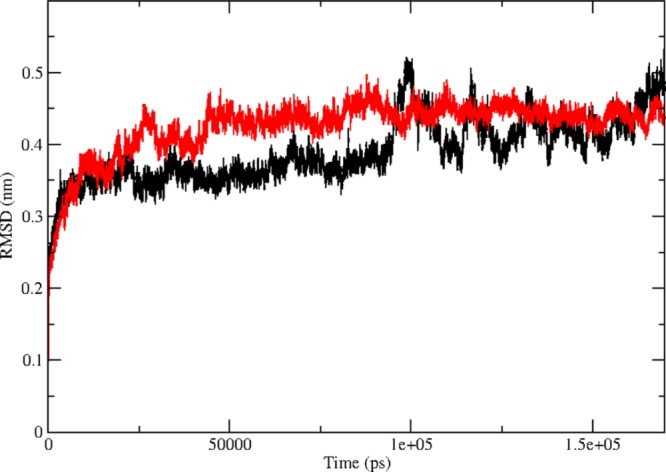
Time evolution of backbone RMSDs are shown as a function of time of the native and mutant p110α protein structures at 300 K. The symbol coding scheme is as follows: native (black) and mutant (red).

Time evolution of backbone RMSDs are shown as a function of time of the native and mutant p110α protein structures at 300 K. The symbol coding scheme is as follows: native (black) and mutant (red).