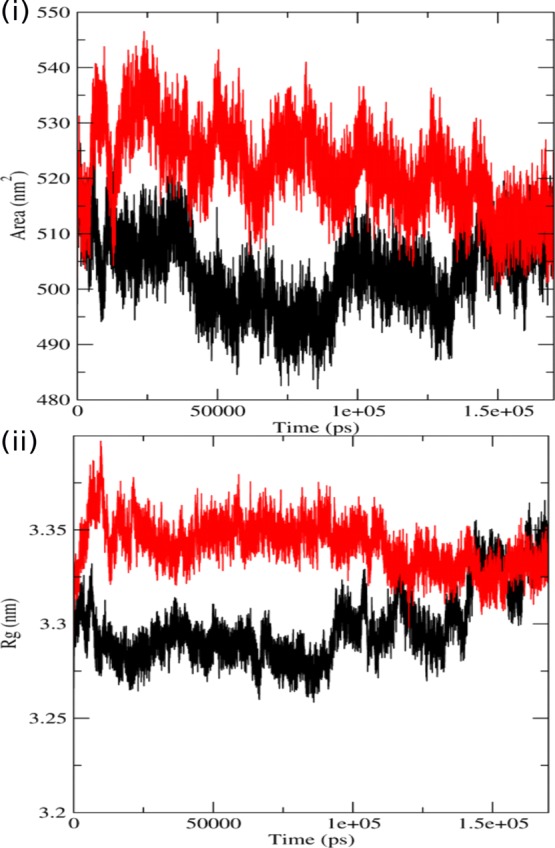
Figure 3.

Analysis of simulation trajectory of native and mutant proteins. (i) SASA of native and mutant p110α vs time at 300 K. (ii) Radius of gyration of Cα atoms of native and mutant p110α protein vs time at 300 K. The symbol coding scheme is as follows: native (black) and mutant (red).
