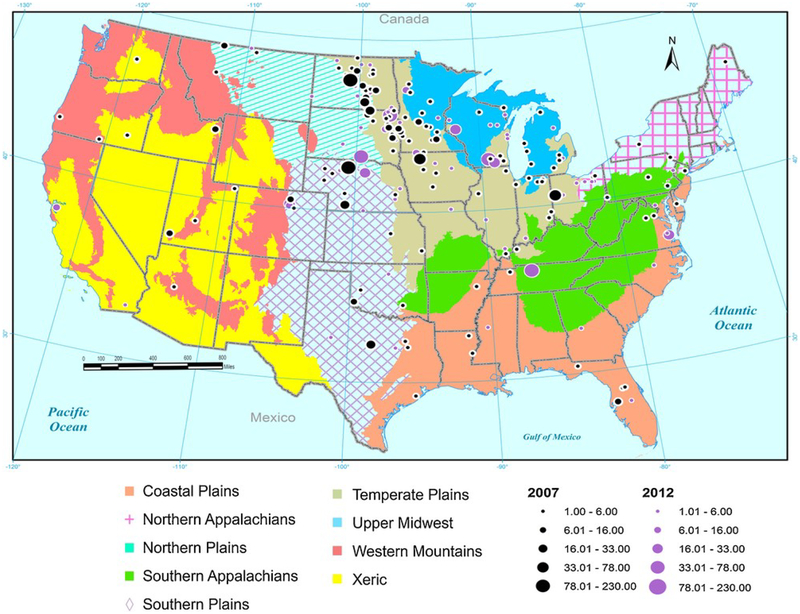
Fig. 1.
Map of the U.S. showing 9 ecoregions and distribution and relative concentrations (ppb) of microcystin in samples containing at least 1 ppb from the 2007 (black) and 2012 (purple) NLA. (For interpretation of the references to colour in this figure legend, the reader is referred to the web version of this article).

