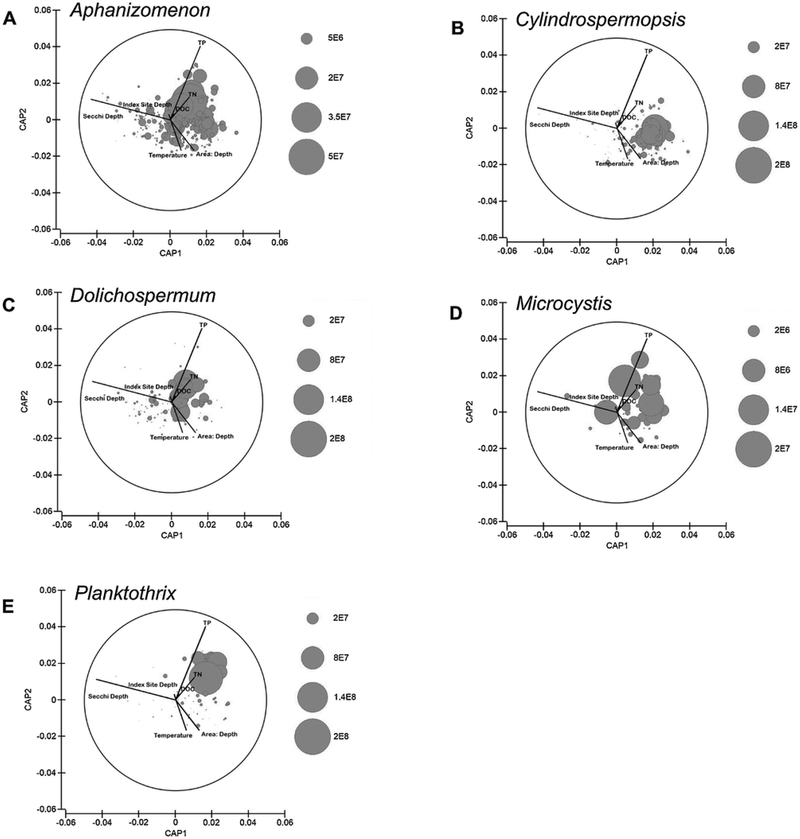
Fig. 5.
Ordination diagrams from the CCA comparing phytoplankton biovolume with environmental variables. Each bubble represents one sample, while bubble size represents relative biovolume (μm3 L−1) for A) Aphanizomenon spp., B) Cylindrospermopsis spp., C) Dolichospermum spp., D) Microcystis spp. and E) Planktothrix spp.

