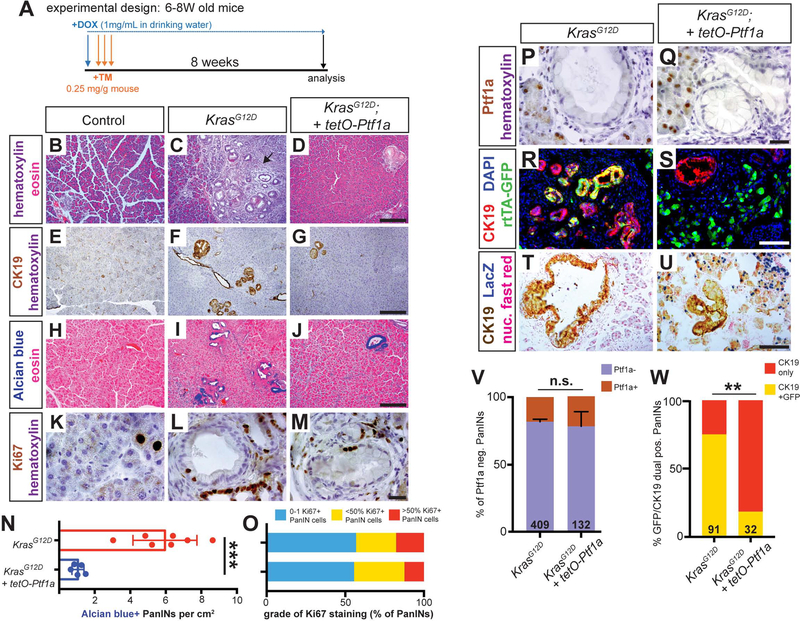
Figure 2. Sustained Ptf1a expression prevents KrasG12D-driven PanIN formation.
(A) Mice of indicated genotypes were started on DOX (1 mg/ml in drinking water) 24 hours before TM administration (0.25 mg/g body weight, daily over 3 consecutive days). Mice were euthanized 8 weeks (8W) after the final TM treatment. (B-D) H&E staining of pancreata from mice of indicated genotypes 8W after TM administration (20x). Arrow in C indicates inflammatory stromal reaction in KrasG12D pancreas. Staining for CK19 (E-G) and Alcian blue (H-J) highlights reduced PanIN burden in KrasG12D; tetO-Ptf1a pancreata compared to KrasG12D alone (all images 20x, scale bar = 200 μm). (K-M) Ki67 staining in PanINs of indicated mouse genotypes (100x, scale bare = 25 μm). (N) Quantification of Alcian blue+ PanIN burden, indicating drastic reduction in lesions in KrasG12D; tetO-Ptf1a pancreata over KrasG12D alone (P<0.001, n=5–7 mice per group). (O) Quantification of PanINs graded for proliferation based on Ki67 staining; no significant difference between genotypes (n.s.). (P-Q) Ptf1a staining is absent in PanINs of both genotypes, compared to adjacent acinar cells (100x, scale bare = 25 μm). (R-S) Immunofluorescence for the duct marker CK19 (red), GFP (R26rtTA. green), and DAPI (blue) (20x, scale bar is 100 μm). (T-U) Staining for CK19 (brown), βgal (tetO-Ptf1a, blue) and nuclear fast red (40x, scale bar = 100 μm). (V) Proportion of PanINs that are completely Ptf1a negative vs. those that harbor one or more Ptf1a-positive cell(s) (n.s., n=5 mice per genotype). (W) Proportion of CK19+/GFP+ dual-positive PanINs (Fisher’s exact test, p<0.01). Numbers on bar graphs indicate total lesions scored, across 3–5 mice per group. ** p<0.01, ***p<0.001.

