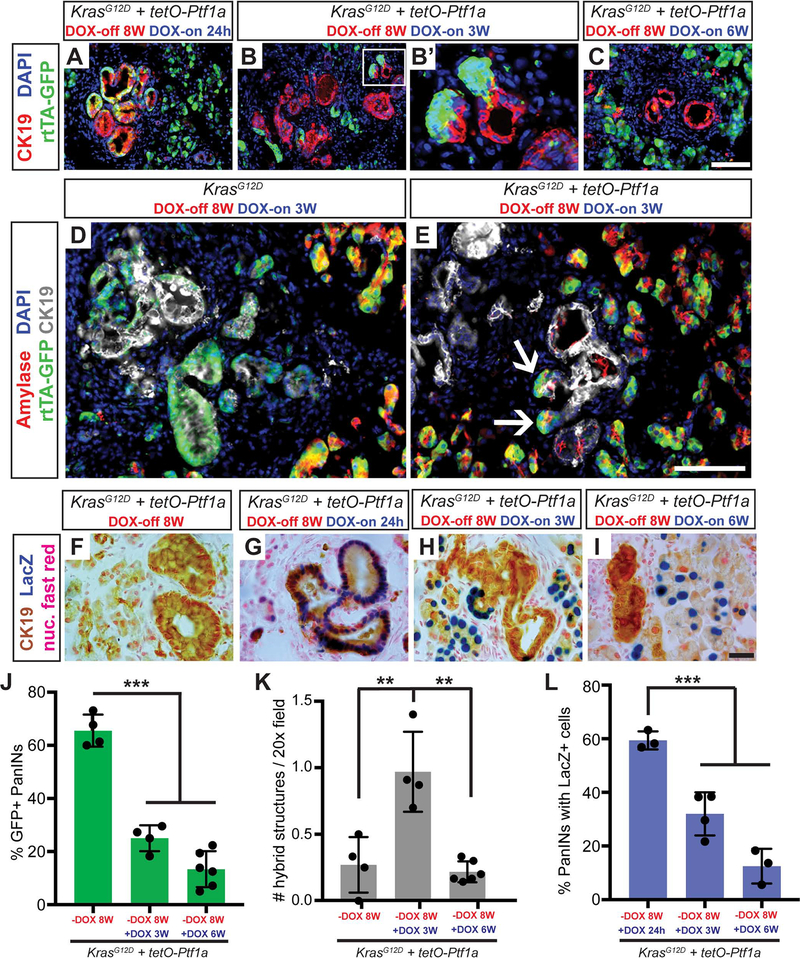
Figure 4. Re-activation of Ptf1a in PanINs reverses premalignant cell phenotypes.
(A-C) Immunofluorescence for CK19 (red), GFP (R26rtTA, green), and DAPI (blue) in KrasG12D + tetO-Ptf1a pancreata following indicated treatments (20x, scale bar is 100 μm). (B’) Enlarged image highlighting GFP+ acinar cells emerging from CK19+ lesions. (D-E) Immunofluorescence for amylase (red), GFP (R26rtTA, green), CK19 (white), and DAPI (blue) in KrasG12D and KrasG12D + tetO-Ptf1a pancreata following indicated treatment (20x, scale bar is 100 μm). (E) Arrows indicate Amylase/GFP-dual positive cells emerging from CK19+ lesions. (F-I) Staining for CK19 (brown), βgal (tetO-Ptf1a, blue) and nuclear fast red in pancreata of indicated treatment groups (100x, scale bar is 25 μm). (J-L) Quantification of proportion of GFP+ PanINs (J), number of PanIN/acinar hybrid structures per field (K), and proportion of βgal+ PanINs (L) for mice of indicated treatment groups. ** p<0.01, *** p<0.001, as determined by ANOVA.

