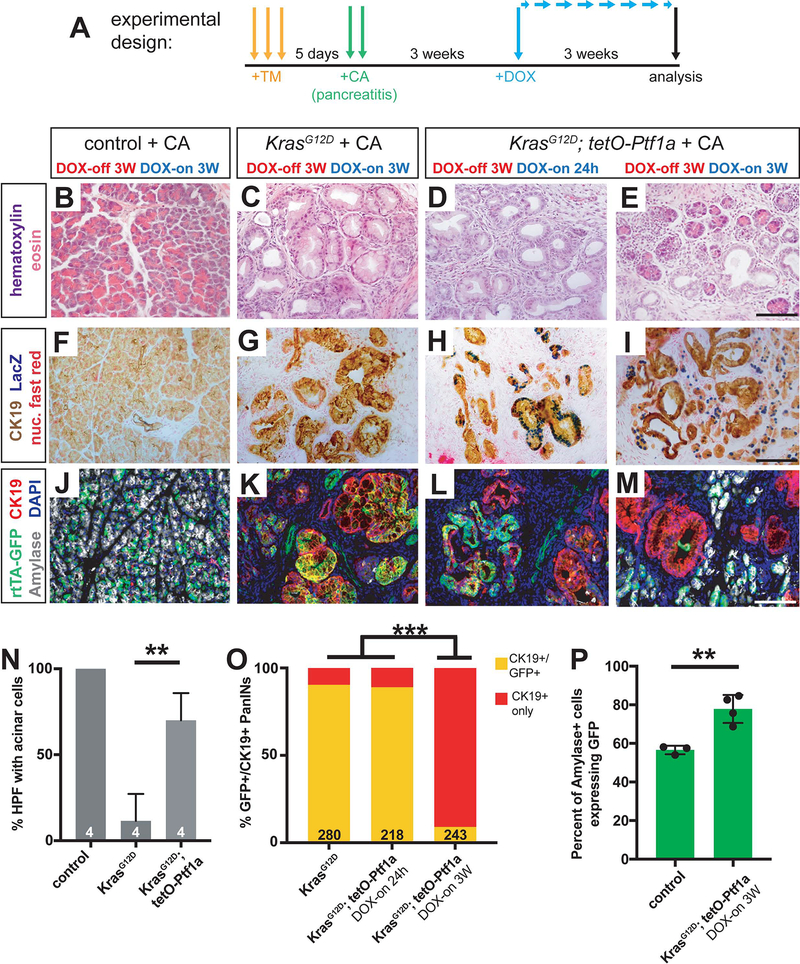
Figure 5. Ptf1a induces acinar cell re-differentiation from PanIN cells after caerulein-induced pancreatitis.
(A) Mice of indicated genotypes were administered TM (0.25 mg/g body weight, daily over 3 consecutive days), and five days later administered six hourly injections of 0.1 μg/g caerulein for two consecutive days. Three weeks after the last caerulein injection, mice were administered DOX (1 mg/ml in drinking water) for either 24 hours or 3 weeks before pancreatic histology was examined. (B-E) H&E staining of pancreata from mice of indicated genotypes and treatment regimens (40x, scale bar is 100 μm). (F-I) Staining for CK19 (brown), βgal (tetO-Ptf1a, blue) and nuclear fast red in pancreata of indicated treatment groups (40x, scale bar is 100 μm). (J-M) Immunofluorescence for CK19 (red), GFP (R26rtTA, green), Amylase (white), and DAPI (blue) in Control, KrasG12D and KrasG12D + tetO-Ptf1a pancreata following indicated treatment (20x, scale bar is 100 μm). (N) Quantification of percentage of high-powered fields (HPF, 40x) containing acinar cells with normal morphology following the treatment protocol in (A) (unpaired t-test, P<0.001). (O) Percentage of CK19+ PanINs co-expressing GFP in KrasG12D and KrasG12D + tetO-Ptf1a pancreata following the indicated treatments (Fisher’s exact test, P<0.001). The number on the bar graph indicate the number of lesions counted between 3–4 mice per group. (P) Quantification of the percentage of amylase+ cells that co-express GFP in Control and KrasG12D + tetO-Ptf1a pancreata following the treatment protocol outlined in (A) (unpaired t-test, P<0.01, n=3–4 per group).

