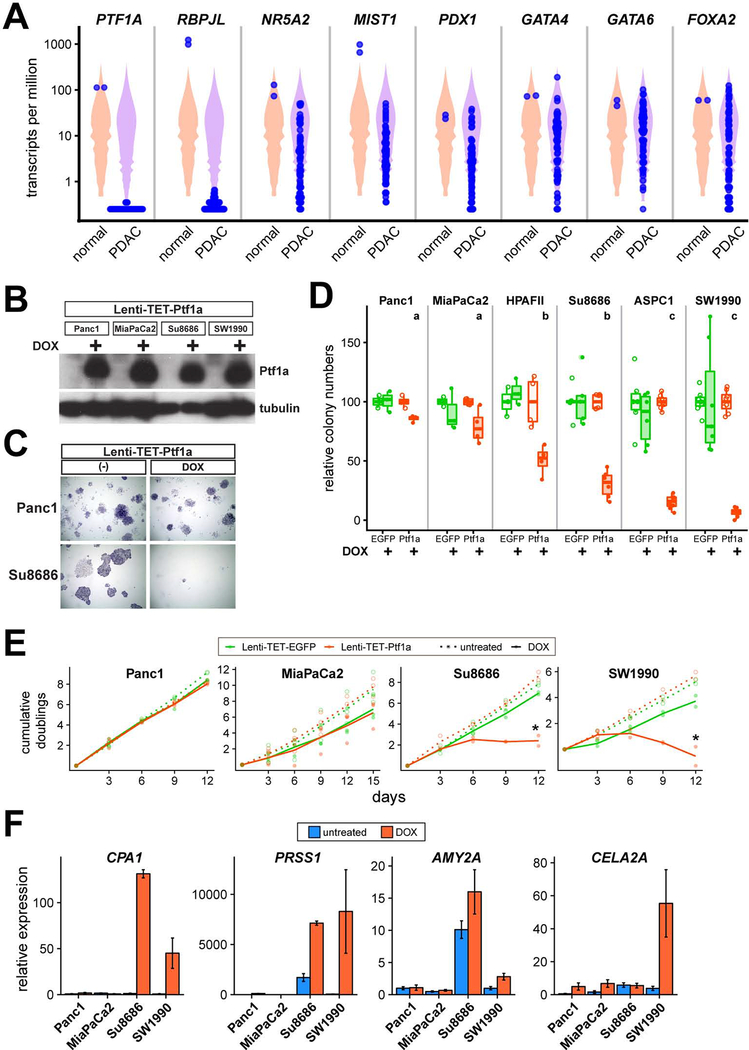
Figure 7. Ptf1a inhibits growth of human PDAC cells.
(A) Expression of PTF1A and other acinar regulators in normal human pancreas (n=2) and PDAC cell lines (n=41), derived from public RNA-seq datasets. Expression plotted in transcripts per million, with individual samples plotted in blue over violin plots representing all expressed genes in each sample. (B) Western blot of Ptf1a and tubulin (control) expression in Lenti-TET-Ptf1a derivatives of Panc1, MiaPaCa2, Su8686 and SW1990 cells, treated −/+ DOX (1 μg/ml) for 48 hrs. (C) Representative images from clonogenic growth assays of Panc1 and Su8686 Lenti-TET-Ptf1a cells, grown 2 weeks −/+ DOX and stained with crystal violet. (D) Quantification of relative clone numbers in indicated PDAC cell lines, transduced with Lenti-TET-EGFP (green) or Lenti-TET-Ptf1a (orange), grown 10–14 days −/+ DOX (open vs. closed circles). Distinct lowercase letters indicate p<0.05 from ANOVA followed by Tukey’s post-hoc test of DOX-treated Lenti-TET-Ptf1a cells. (E) Cumulative population doublings of indicated PDAC cells, transduced with EGFP or Ptf1a (green vs orange). Cells were counted and replated at constant densities every 3 days, and treated from day 1 onwards −/+ DOX (open vs. closed circles for individual experiments, dotted vs. solid lines representing means). * P<0.05, DOX-treated Ptf1a vs EGFP cells. (F) Expression of indicated genes in PDAC cell lines transduced with Lenti-TET-Ptf1a, grown 48 hrs −/+ DOX (blue vs. orange), and analyzed by RT-qPCR (ΔΔCt method, normalized to PPIA expression within each sample and untreated Panc1 cells across samples).

