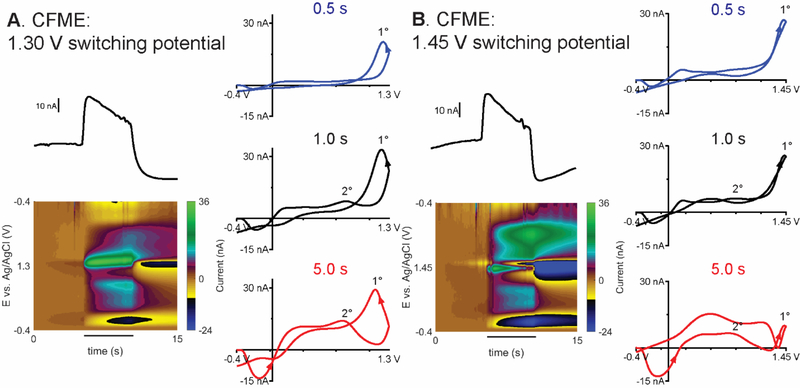
Fig. 5.
FSCV of 1 μM histamine at CFME. Current-time trace, false color plot, CVs at 0.5-s, 1.0-s and 5.0-s injection from different FSCV switching potential: (A) 1.30 V and (B) 1.45 V. Black lines under the color plots indicate histamine was flowing by the electrode. 1º and 2º indicates primary and secondary anodic peak, respectively. More detailed peak labelling can be found in Fig. S5.

