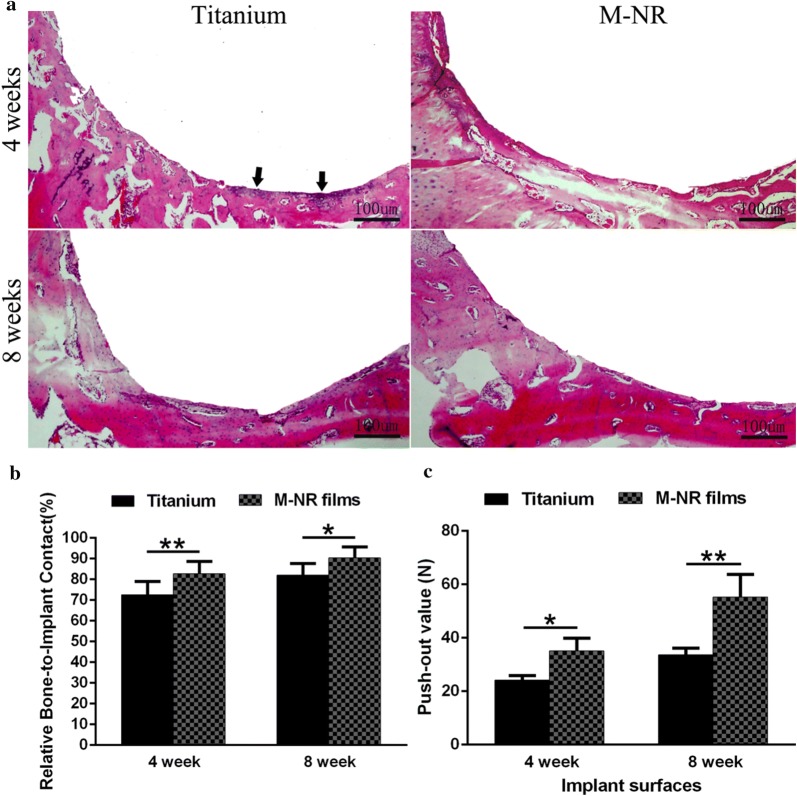
Fig. 6.
In vivo evaluation of osteointegration of the quasi-three-dimensional hierarchical topography. a Histologic analysis at the bone-implant interface of clinical titanium (control) and M-NR group after implantation for 4 and 8 weeks. The arrows indicate the inflammation regions. b The corresponding quantitative analysis of the relative bone-to-implant contact. c The evaluation of push-out strength (n ≥ 5)

