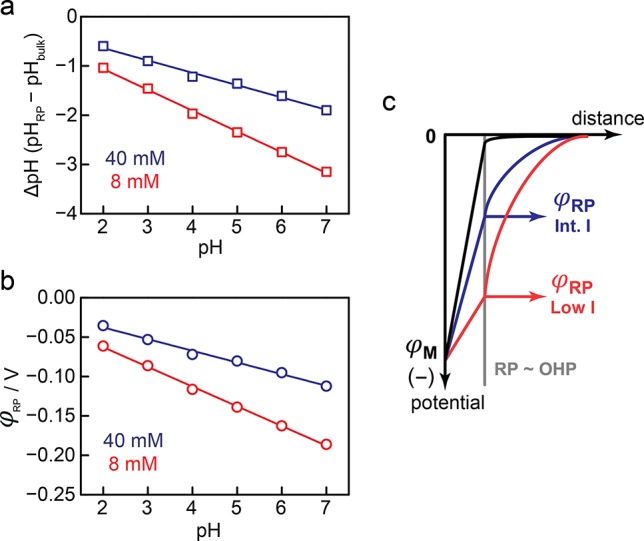
Figure 5.

(a) ΔpH (= pHRP – pHbulk) as a function of bulk pH for data collected at 40 (blue) and 8 (red) mM Na+. Values were calculated from the data in Figure 2a,b. (b) Electrostatic potential at the reaction plane (φRP) vs bulk pH. Values were calculated using the ΔpH and eq 2. (c) Diagram of the interfacial electrostatic potential profile at very high, >280 (black), intermediate, 40 (blue), and low, 8 (red), mM Na+ concentration at fixed pH.
