
Figure 6.
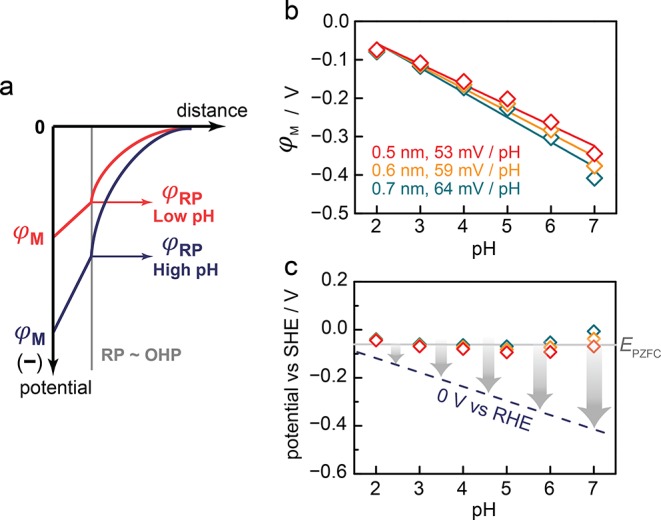
(a) Diagram of the interfacial electrostatic potential profile under low ionic strength conditions at low (red) and high (blue) pH. (b) Electrostatic potential at the Pt surface (φM) vs bulk pH, computed using the φRP in Figure 5b, red, eq 3, and varying xOHP distances of 0.5 (red), 0.6 (orange), and 0.7 (green) nm. (c) Potential vs bulk pH Pourbaix diagram showing the pH dependence of the reversible hydrogen couple (blue, dotted line) and the effective EPZFC values estimated from our analysis assuming xOHP of 0.5 (red), 0.6 (orange), and 0.7 (green) nm.