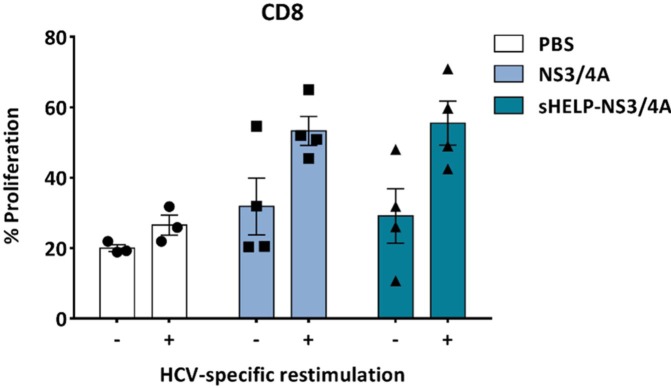
Figure 3.
The proliferation of HCV-specific T cells upon in vitro restimulation. Splenocytes isolated from SFV immunized mice were labeled with CFSE and cultured in the presence (+) or absence (–) of irradiated Hepa1-6VenusnsPs cells at a 25:1 ratio for 4 days. Subsequently, the percentage of proliferating cells was analyzed by flow cytometry after staining with anti-CD8a. The bars represent the percentage of proliferating daughter CFSE+CD8+ cells (sum of generation 1–7) within the total CFSE+CD8+ cells (sum of generations 0–7). Data represent mean ± SEM (n = 3–4).

