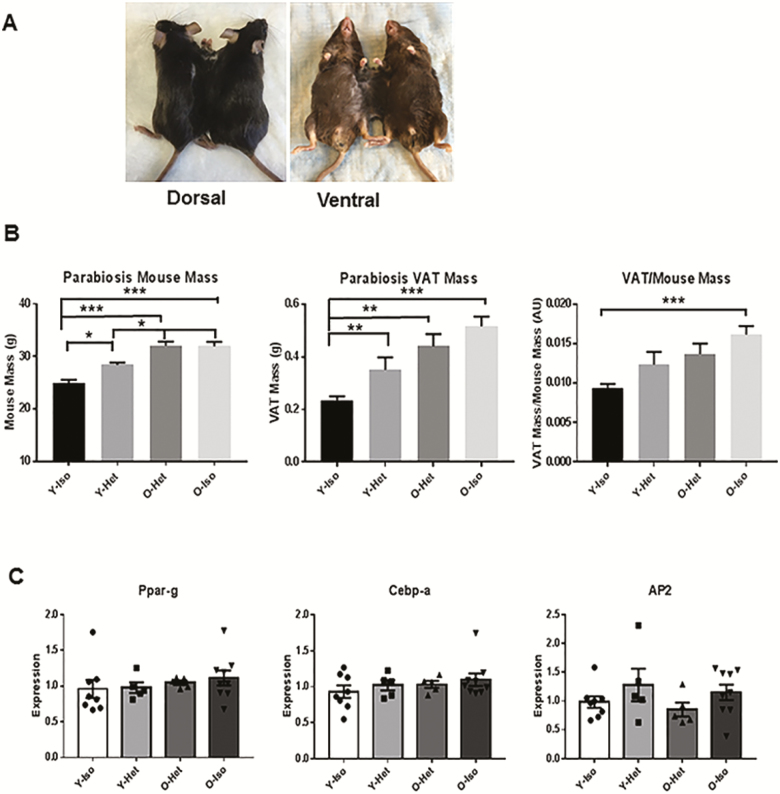
Figure 1.
Increased body weight (BW) and visceral adipose tissue (VAT) mass in young but no change in old mice because of heterochronic parabiosis. (A) Photographs of heterochronic pairs both dorsal and ventral views. (B) Graphical representation of body weight and VAT weight and the ratio of BW:VAT of young (4 month) isochronic (Y-Iso), young heterchronic (Y-Het), old (20 month) heterochronic (O-Het), and old isochronic (O-Iso) pairs (n = 12 each) following 4 weeks of parabiosis. Statistical significance was determined by Tukey’s multiple comparison test followed by analysis of variance and indicated as *p < .05, **p < .001, ***p < .0001. (C) Relative mRNA abundance of Ppar-g, Cebp-a, and Ap2 in the parabiosis groups were also plotted in the graph after normalization (n is represented by no. of dots) with Gapdh expression. Statistical significance was determined by paired t test.

