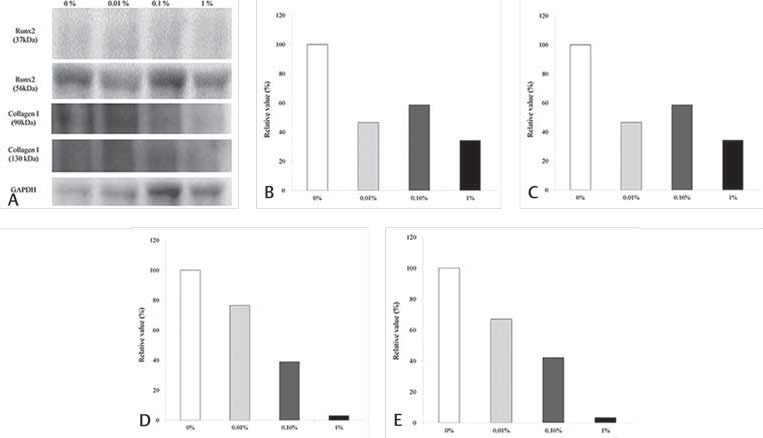
Fig. 4.

Western blot analysis to detect the protein expression of Runx2 and collagen I at day 10 and quantitative analysis of the protein expression of Runx2 and collagen I after normalization with GAPDH levels by densitometry. ( A ) . Western blot analysis results. ( B ) Runx2 (37 kDa) expression on osteogenic media. ( C ) Runx2 (56 kDa) expression on osteogenic media. ( D ) Collagen I (90 kDa) expression on osteogenic media. ( E ) Collagen I (130 kDa) expression on osteogenic media. GAPDH, glyceraldehyde 3-phosphate dehydrogenase.
