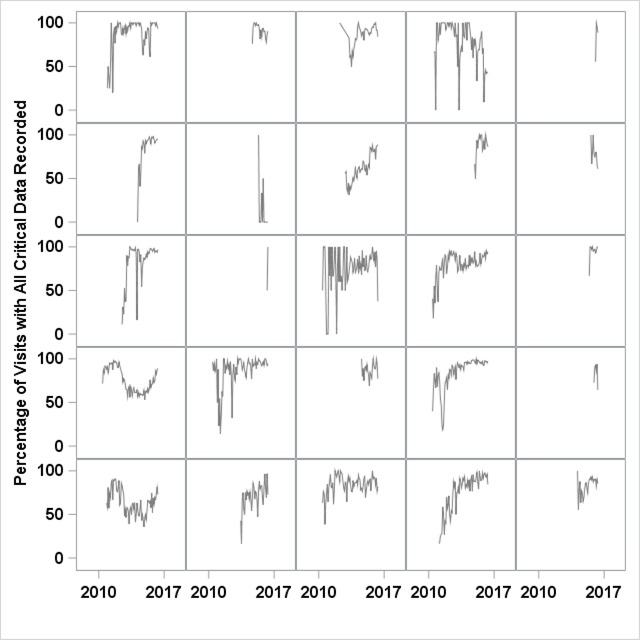
Figure 5.

Random sample of 25 centers exposed to data quality reporting and training, showing intra-visit data completeness over time. For each center, the percentage of visits each month with complete critical data elements is indicated on the y-axis. The x-axis indicates June 2010 through June 2016.
