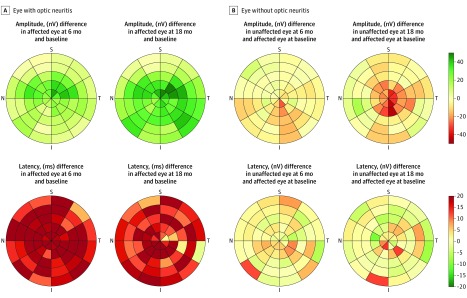
Figure 3. Change Over 6 Months and 18 Months in the Amplitude and Latency in the 56 Segments of the Multifocal Visual Evoked Potentials in Affected and Unaffected Eyes.
A heatmap developed by the authors to visualize the changes in latency and amplitude in the multifocal visual evoked potentials segments. Each segment represents the mean change (6-month and 18-month) relative to the baseline value of each participant and eye, except the latency in the affected eye, for which the baseline value of the unaffected eye was a reference. A, Results for the affected eye; B, Results for the unaffected eye. A color scale is used to represent the magnitude and direction of the changes. Amplitudes were measured in nanovolts and latencies as milliseconds. The numbers represent the 6-month and 18-month changes; green represents improvement (increase in amplitude and decrease in latency relative to the baseline), while red represents worsening. I indicates inferior; N, nasal; S, superior; and T, temporal.

