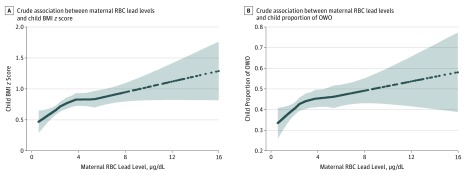
Figure 1. Smooth Plots of Maternal Red Blood Cell (RBC) Lead Levels and Child Body Mass Index (BMI) z Scores and Child Proportion of Overweight or Obesity (OWO).
Because of the small sample size, the curves are truncated at 16 μg/L (n = 18). The curves (and 95% CIs [indicated by the shaded areas]) were derived from smoothing plots generated using the PROC LOESS step in SAS statistical software (version 9.4; SAS Institute Inc). To convert lead level to micromoles per liter, multiply by 0.0483.

