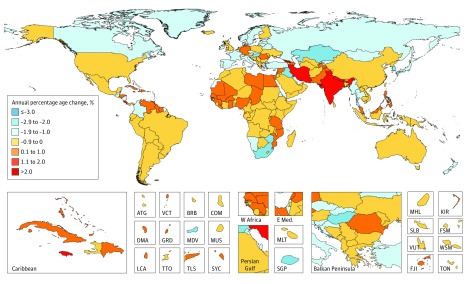
Figure 2. Average Annual Percentage Change in Age-Standardized Mortality Rate in Both Sexes for All Cancers From 2007 to 2017.
ATG indicates Antigua and Barbuda; BRB, Barbados; COM, Comoros; DMA, Dominica; E Med., Eastern Mediterranean; FJI, Fiji; FSM, Federated States of Micronesia; GRD, Grenada; KIR, Kiribati; LCA, Saint Lucia; MDV, Maldives; MLT, Malta; MUS, Mauritius; MHL, Marshall Islands; SGP, Singapore; SLB, Solomon Islands; SYC, Seychelles; TLS, Timor-Leste; TON, Tonga; TTO, Trinidad and Tobago; VCT, Saint Vincent and the Grenadines; VUT, Vanuatu; W Africa, West Africa; WSM, Samoa.

