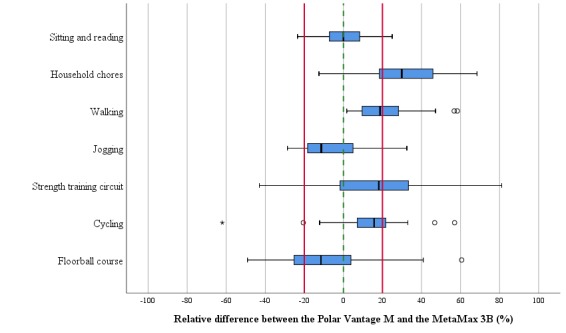
Figure 2.

Relative deviation of the energy expenditure (EE) estimation by the Polar Vantage M compared with the criterion measurement of the MetaMax 3B separated for each activity task. The red lines indicate the proposed equivalence zone (SD 20% of the mean); the lower and upper boundary of the boxplots indicate the 25% and 75% quantiles of EE data, respectively, and the middle notch indicates the median data value. The whiskers include all data points that fall within the 1.5 interquartile range of the 25% and 75% quantile values. Circles and stars indicate EE data points that lie beyond the 1.5 and 3 interquartile ranges, respectively.
